UWWTD and the implications of energy neutrality in wastewater treatment − Save your energy


Simon Judd
Director at Judd Water & Wastewater Consultants
1. Energy consumption and environmental impact
Energy consumption remains a significant factor in the selection of technologies for water and wastewater treatment, not only because of the spiralling cost of energy but also because of legal requirements.
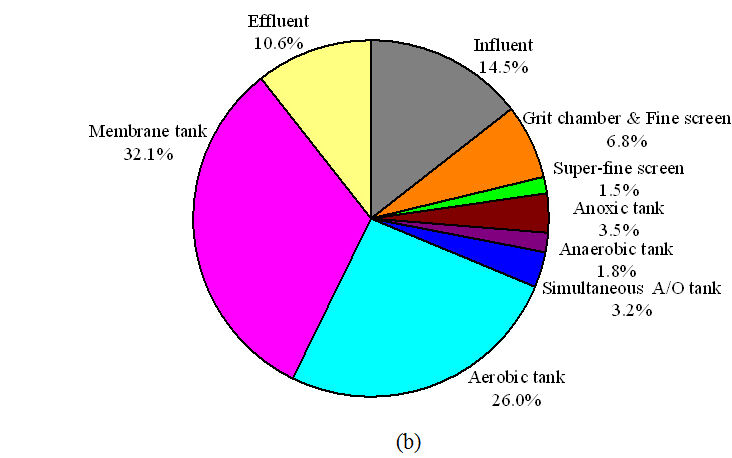
A distinction must be made between energy consumption, carbon footprint and environmental impact. Energy consumption refers only to energy − often expressed as the consumption in kWh normalised against the volume of water treated in m3 (hence specific energy consumption in kWh/m3). This is the same as the absorbed power (in kW) divided by the treated wastewater flow in m3/h.
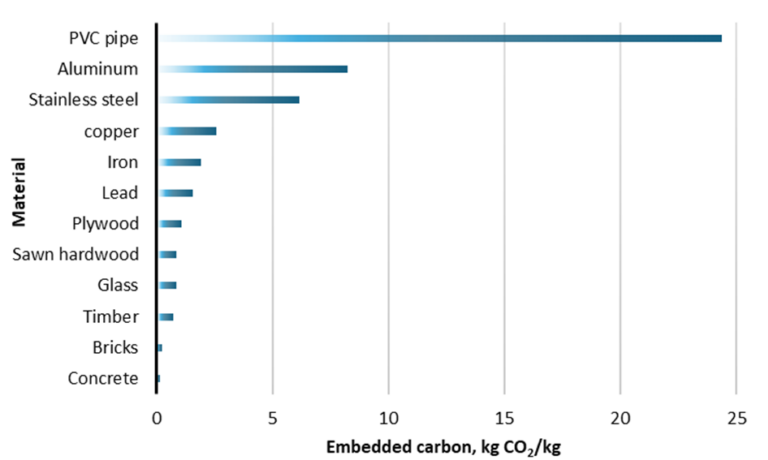
The carbon footprint (CF) relates to the emissions of all greenhouse gases (GHGs). The most predominant of these is carbon dioxide (CO2), part of which can be directly linked to consumed energy in kWh, but also other GHGs − ostensibly methane (CH4) and nitrous oxide (N2O). For grid electricity in the UK, it's around 0.22 kg CO2-equivalents per kWh (ITP Energised, 2024), where the CO2 equivalent unit encompasses all GHGs. The CF also includes the embedded (or embodied) carbon of the infrastructure and mechanical/electrical components (‘M&E’) of the capital equipment at a WwTW. As with energy, the embedded CF of a material can be quantified. For concrete, it’s around 0.16 kg CO2-equivalents per kg, whereas for aluminium it’s around 8−10 kg CO2-equiv/kg on average, the precise figures for these materials depending on the method of their production (Fig. 1). So, aluminium incurs roughly around 50 times the CF of concrete.
Environmental impact encompasses all factors and parameters exerting an influence on the environments, including energy consumption, carbon footprint and emissions of GHGs and pollutants generally. Environmental impact assessment (EIA) can be quantified through life cycle analysis/assessment (LCA).
2. Energy consumption and EU legislation
Energy minimisation forms a key component of the latest revision of the EU Urban Wastewater Treatment Directive (UWWTD) (EU, 2024). UWWTD, which dates back to 1991, concerns the management and discharge of wastewater to environmental water bodies. Lower permitted effluent concentration limits, particularly with reference to nutrients, were originally set for larger flows and/or sensitive receiving water bodies so as to restrict the pollutant load to the environment as a whole.
The latest revision of UWWTD, first proposed in October 2022 and subject to various modifications since, includes tighter constraints on nutrient discharges and new limits for micropollutants for larger plants (Table 1). The removal of many micropollutants demands quaternary treatment, or polishing. In addition, these larger installations (>10,000 p.e. capacity) are required to achieve energy neutrality by 2040. There is a further requirement to audit energy use (in accordance with Directive 1791 from 2023) and make the results public. Crucially, the large WwTWs should achieve both energy neutrality and reduced GHG emissions by 2040.
| Item | 2025 | 2030 | 2035 | 2040 |
|---|---|---|---|---|
| Stormwater overflows, urban runoff | Monitoring in place | Integrated plans, identification of risk areas (>100k p.e.) | Integrated plans in place (10−100k p.e.) | Indicative EU target (>10k p.e.) |
| Nutrients (N & P) | Identification of areas at risk (10−100k p.e.) | Interim target for removal, new standards (>100k p.e.) | Removal at all facilities (>100k p.e.), interim target for areas at risk | Removal in place at all areas at risk (10−100k p.e.) |
| Micropollutants | Setting up of extended producer responsibility schemes | Identification of areas at risk (10−100k p.e.), interim target (>100k p.e.) | All facilities equipped (>100k p.e.), interim targets for areas at risk | All facilities at risk equipped with advanced treatment |
| Energy | Energy audits (>100k p.e.) | Audits for all facilities (>10k p.e.), interim target | Interim target for energy neutrality | Energy neutrality and related GHG reduction met |
It is self-evident that applying quaternary treatment will inevitably lead to greater energy consumption. Moreover, the additional equipment required for removing the more biorefractory of the pollutants, technologies like reverse osmosis and electrochemical oxidation, will increase the overall CF of the installation through both the additional energy consumption and the embedded carbon. Embedded carbon is often associated just with building materials, rather than mechanical and electrical (M&E) equipment. This isn’t unreasonable, given the amount of concrete used in infrastructure generally, but stainless steel has roughly 10 times the embedded CF as concrete and it can feature quite prominently in, for example, desalination plants.
Regardless of the extent of internal energy recovery from the various elements of the WwTW, there will inevitably be an increased reliance on bulk renewable energy sources for achieving the energy neutrality goal required. The latest UWWTD revision permits the supply of renewable energy from an external source, but no more than 35% of the total. The remaining 65% must come from within the WwTW site − either by recovery from the organic carbon as biogas or from installing solar panels, wind turbines or other renewable energy infrastructure. As with quaternary treatment, this increases the embedded CF, but notionally delivers energy at a very low maintenance cost.
3. Energy and CF minimisation
Decreasing energy consumption has obvious cost and environmental benefits. At a WwTW a proportion of the energy consumed can be recovered by harnessing the latent energy of the biodegradable organic carbon (OC).
OC is removed at a WwTW primarily either by:
a) physical separation at the primary stage
b) conversion to CO2 by aerobic biological processes at the secondary stage, or
c) conversion to microbiological material (or cells) at the secondary stage.
The waste carbon, which forms the sludge streams from the WwTW process, is then subject to further processing – most often anaerobic digestion (AD) for large sites.
The secondary stage (b and c above) demands the addition of pumped air, which consumes roughly half the energy at the site. The OC in the waste streams from the primary and secondary processes (a and c above) contains latent energy which can be recovered as methane from the biogas generated by the AD process.
There are therefore essentially three options for reducing energy at a site:
- recovery of the waste OC, usually as methane (CH4)
- reducing the biological aeration demand of the secondary process, and/or
- using renewable energy sources.
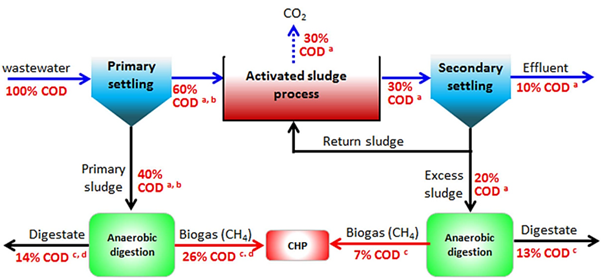
All of the above have repercussions regarding CF. This can best be demonstrated by considering the fate of OC through a WwTW process. For the purposes of this discussion, the COD (or OC) balance presented by Wan et al (2016) will be used. According to these authors (Fig. 2):
- 40% of the OC is removed by primary sedimentation and directed to the AD
- 30% is converted to CO2 and discharged to the atmosphere following the aerobic treatment stage
- a further 20% is directed to the AD as waste activated sludge (WAS) from the aerobic stage, and
- 10% is discharged into the effluent.
3.1 Recovery of the waste OC as methane
Recovery of OC as methane from sludge streams using AD is undertaken at many large WwTWs. Because of the significant investment costs (and so embedded carbon) associated with AD, it tends to be only viable at larger sites, and sludge is often imported from neighbouring sites to maximise the use and operational efficiency of the AD facility. AD also reduces the sludge waste volume and produces a stabilised product.
However, methane is a GHG equating to 25 kg CO2-equivalents per kg CH4. Recovering energy from sludge leads to an increased risk of CH4 emissions from the AD process; CH4 losses from wastewater treatment biogas plants can account for as much as 15% of the total CH4 generated (Scheutz & Fredenslund, 2019). Therefore, minimising these fugitive emissions is essential in maintaining a CF benefit.
3.2 Reducing the biological aeration demand
Reducing the aeration energy can be achieved physically by increasing blower and aerator efficiency, through simple actions like maintenance and cleaning. Aerator efficiency can be significantly improved using membrane aeration, though this then also increases the aerator capital cost.
Aeration demand can also be decreased by changing the biological process to:
- nitritation/denitritation or the anammox process, for N removal, or
- anaerobic treatment for OC removal.
3.2.1 N removal
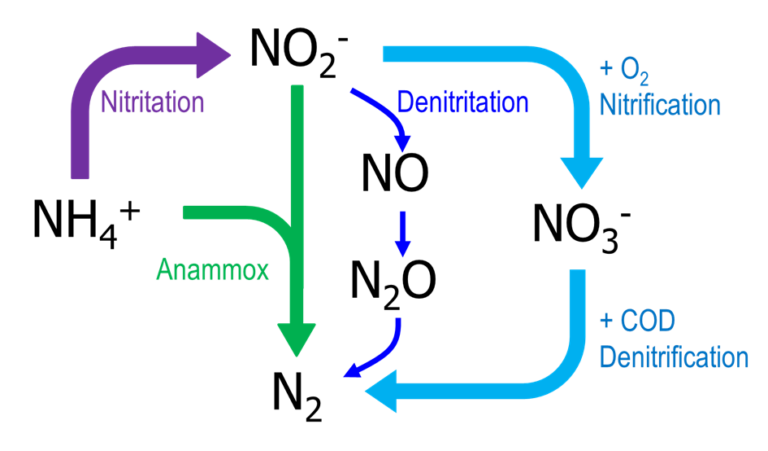
Nitritation/denitritation can save up to 25% of the total oxygen demand and 40% of the carbon demand compared with conventional nitrification/denitrification, based purely on the biochemical stoichiometry of the two processes (Figure 3). For the anammox process, the corresponding figures are 45 and 79% respectively (Arora et al, 2021). However, the nitrite accumulation associated with these processes increases the propensity to form nitrous oxide (N2O). As a GHG, N2O is around 300 times more destructive than CO2. Added to this is the challenge of sustaining these biological processes, which are less robust than conventional nitrification/denitrification. N2O emissions from wastewater treatment have been extensively studied, with research publications dating back to at least the early 1990s (Hanaki et al, 1992).
3.2.2 OC removal
Anaerobic treatment of the main wastewater flow, rather than the WAS, can potentially convert most of the OC directly to CH4, with aerobic treatment required only for removing the residual ~10% OC along with the ammoniacal nitrogen.
However, this leads to an even greater challenge with fugitive methane emissions than those associated with AD. This arises from the solubility of CH4 in water, which is quite high at ~25 mg/Lat ambient temperatures. For a medium strength sewage of ~500 mg/L COD (~200 mg/L OC), of which 40% is removed at the primary stage, more than 70% of the CH4 potentially generated anaerobically would remain dissolved in the treated wastewater. This residual can only effectively be removed by efficient stripping – possibly using a membrane contactor. This presents considerable practical and economic challenges given the large water flows involved when compared with the sludge AD process. The residual methane, if released to the atmosphere, would otherwise incur a CF at least double that associated with conventional aerobic treatment.
It is not just the operational CF which is affected by switching to an anaerobic process. Anaerobic processes are normally much slower than aerobic ones, demanding larger tanks. This then implies more concrete and thus increased embedded carbon, increasing the overall CF.
The issues regarding potential GHG emissions appears to be acknowledged in the latest revision of UWWTD, with the text: initiatives to achieve energy neutrality should not lead to an increase in the emissions of methane and nitrous oxide (EU, 2024). This aligns with the 2040 goal of energy neutrality without additional GHG emissions.
3.3 Renewable energy sources
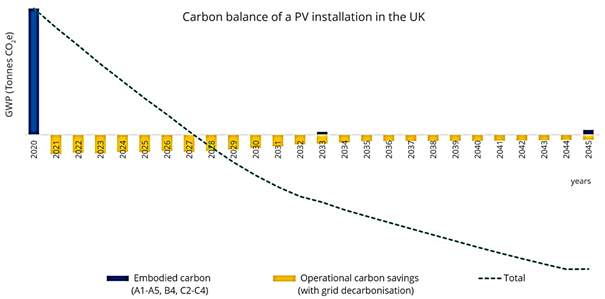
The viability of installing solar panels and other renewable energy-generating facilities is dependent largely on the layout of the existing WwTW infrastructure and the available space, along with available energy sources. In the case of solar energy, the most commonly-harnessed renewable energy source, the implemented photovoltaic cells have been determined to have a significant embedded carbon content (Hamot et al, 2022), such that overall CF neutrality is only achieved after more than seven years (Fig. 4) – and perhaps longer if end disposal is also taken into account.
4. Outlook
The combined energy neutrality and greenhouse gas (GHG)-reduction goal for 2040, identified in the latest revision of the Urban Wastewater Treatment Directive, presents a number of quandaries. The low-energy nitrogen removal options of nitritation/denitritation and anammox have not been widely implemented for municipal wastewater treatment. They require very precise process control to mitigate the risk of nitrous oxide (N2O) emissions, this being an extremely significant greenhouse gas. Anaerobic treatment of sewage for carbon removal leaves a substantial proportion of the methane in the treated water, demanding a potentially expensive and impractical downstream degassing stage.
Taking all these risks into account, the classical option of aerobic treatment coupled with centralised anaerobic digestion (AD) for the sludge stream may be the prudent approach, with solar energy as the primary power source. A recent life cycle assessment (Viotti et al, 2024) suggests that supplementary sludge AD and solar power can reduce CO2-eq emissions from an MLE CAS installation by 75%. There has also been practical progress in addressing fugitive GHG emissions – such as the use of fuzzy controllers for suppressing N2O formation (Santín et al, 2023).
MBR technologies are thought to increase N2O emissions due to the stripping effect of the membrane air scour (Mannina et al, 2020). Against this, they provide a robust option for achieving high-clarity treated effluent and effective nutrient removal, and are becoming the go-to technology for indirect potable water reuse.
There is clearly much work to be done to achieve the EU 2040 goal of combined energy neutrality and minimal GHG emissions. Perhaps the most obvious requirement is information – specifically regarding the correlation between whole-life carbon (or GHG emissions) and key parameters for both design (biological process technology configuration, hydraulic retention time, nutrient management scheme) and operation (solids retention time, DO setpoint, sludge recycle rate, etc). This is a monumental task, but one which has to be addressed if the environmental benefit of all candidate wastewater treatment processes is to be quantified.


