The disinfection capability of MBRs: credit where credit’s due


Stephen Katz (pictured)1, Andrew Salveson2, Nicola Fontaine2,
Bob Bucher3 and Joshua Berryhill4
1SUEZ Water Technologies & Solutions, 2Carolla Engineers, 3King County,
4Enprotec/Hibbs & Todd
1. MBR implementation for water reuse
The increasing focus on indirect and direct potable reuse (IPR/DPR) has placed the onus on regulators to produce a framework to permit the safe implementation of these schemes. This is normally through defining process performance in terms of 'credits'. The assignment of credits is particularly important when it comes to the removal of pathogens, where the credit refers to the log removal or reduction value (LRV) achieved by the process.
The state of California, for example, stipulates a minimum pathogen reduction for virus, Giardia and Cryptosporidium across the complete flow sheet of 12, 10 and 10 LRV respectively for groundwater recharge applications. A single unit operation can be awarded an LRV between 1 and 6, and there must be at least three unit operations in a process train. Whilst the state has also provided regulations for surface water augmentation, the process of developing DPR regulations is ongoing and significant progress is being made for MBRs to receive pathogen removal credits. In the state of Texas, although several potable reuse projects have been implemented, there are targets proposed but there remain no uniform guidelines for implementation of new projects: each are individually reviewed. Australia has launched the WaterVal program to provide a nationally consistent approach to validating water treatment technologies; a method for MBRs has subsequently been identified for validating pathogen removal. Other countries, such as Singapore and South Africa, are also in the process of instigating potable reuse projects and regulations.
MBRs are widely regarded as the go-to technology for water reuse due to the consistently high permeate water quality provided, particularly the low silt density index (SDI <3) required for reverse osmosis (RO) feedwater. Life cycle costs appear to be slightly lower than those associated with classical treatment followed by membrane filtration tertiary treatment. Despite this, the operating application of the technology to IPR/DPR in the US has been limited to the 2015 Hamby WRF in Abilene, Texas.
Currently, a typical IPR/DPR flowsheet comprises conventional activated sludge (CAS), tertiary ultrafiltration (UF) or microfiltration (MF), RO and UV advanced oxidation process (UVAOP). Given that an MBR technology is apparently less expensive and lower in footprint than the CAS−UF/MF approach and provides a comparable treated water quality, it is instructive to examine the two main barriers to the adoption of MBR technology for this duty, namely:
- establishing MBR pathogen removal capability, and
- instigating MBR pathogen removal monitoring.
2. Reported pathogen removal by MBRs
Unlike in the case of regular physical membrane filtration, virus removal by MBRs is not limited to simple size exclusion. Adsorption onto the sludge solids and the membrane cake layer (as well as the membrane itself) represent important removal mechanisms, as well as removal by predation (the feeding on the pathogens by other higher organisms). The relative contribution of these mechanisms is species-dependent, with the larger pathogens (protozoa and bacteria) being predominantly removed by size exclusion (WaterSecure, 2017; WRF, 2012).
Pathogen removal by MBRs from municipal wastewater has tended to focus on bacteria, e.g. total/fecal coliforms and E. coli. However, studies of the removal of viruses, protozoa and bacteriophages (viruses that infect bacteria) have increased in number in recent years. Monitoring of a full-scale MBR fitted with 0.04 µm pore-sized membranes and operating under steady-state conditions has revealed removals in the region of 5−5.1 for human adenovirus and enterovirus (Kuo et al., 2010; Simmons et al., 2011), and up to 6.8 log for norovirus, sapovirus and adenovirus at other sites (Da Silva et al., 2007; Sima et al., 2011).
However, LRVs depend mainly on feed concentrations and the permeate sample volumes: MBR membranes have been shown to provide complete virus removal (Erdal et al., 2017; Hirani et al., 2017), such that the LRV is in effect related to the limit of detection (LoD) of the analytical method. Moreover, median LRVs of 3.01−3.67 for the viruses adenovirus, enterovirus and norovirus were found to be negligibly improved by subsequent UV disinfection. Finally, rejection has been shown to be largely unaffected by recovery and maintenance cleaning events (Ottoson et al., 2006; Hirani et al., 2017; Branch et al., 2015), seasonal changes (Purnell et al., 2016; Sima et al., 2011; Simmons et al., 2011) and membrane age (Nishimori et al., 2010; Pettigrew et al., 2010).
To provide further insight into the rejection capability of MBRs at full scale, a large body of work was commissioned by the Santa Clara Valley Water District (SCVWD) to explore MBRs for potable reuse duties. The study also monitored multiple effluent parameters to identify performance surrogates.
3. Full-scale study
3.1 Experimental method
Two full-scale ZW500-based MBR facilities were investigated, operated under real-world conditions for nine monthS to September 2016:
Site 1: Hamby WRF (Hamby, Abilene, TX; commissioned in 2015): a 12 MGD indirect potable water reuse facility discharging to Lake Fort Phantom Hill reservoir for supplementing freshwater water supplies.
Site 2: Ironhouse SD WRF (Ironhouse, Oakley, CA; commissioned in 2011): a 2.3 MGD average flow plant with Title 22-compliant effluent for non-potable reuse.
Ten sampling campaigns were completed under varying operating conditions to allow impacts of membrane cleaning and seasonal variations to be appraised. Samples were taken from the raw wastewater or primary influent and the MBR permeate, the latter from either a composite sample of all trains (Ironhouse) or taken from a single train (Hamby). Samples, taken using established sampling protocols, were subjected to a range of analyses (Table 1) based on industry accepted standard methods conducted by an accredited third-party laboratory.
| Parameter | Raw wastewater | MBR permeate | Method |
|---|---|---|---|
Notes: | |||
| Male Specific & Somatic Coliphage Phage 1 | X | X | Adams 1959 or EPA 1602 |
| Enterococci | X | X | EPA 1600 |
| Enterovirus and Norovirus 2 | X | X | EPA 1615 |
| Giardia/Cryptosporidium | X | X | EPA 1623 |
| Biochemical Oxygen Demand (BOD) | X | X | 5210B |
| Chemical Oxygen Demand (COD) | X | X | 5220 |
| Temperature, pH, Dissolved Oxygen (DO) | X | Online meter | |
| Total Dissolved Solids (TDS) | X | 2540C | |
| Ammonia, Nitrate, Nitrite | X | X | 4500-NH3, 4500-NO2-, 4500-NO3- |
| Total Organic Carbon (TOC) | X | X | 5310 |
| Turbidity, Electrical Conductivity (EC) | X | Online meter | |
| Particle Counts - Bench-Top | X | 2560D | |
| Ultraviolet Absorbance (UVA) | X | X | Spectrophotometer |
| Fluorescence | X | X | Fluorometer |
| Adenosine Triphosphate (ATP) | X | X | Luminultra system |
3.2 Results and Discussion
LRV data were categorised according to their proximity to membrane cleaning: (1) normal operation, and following (2) a maintenance clean and (3) a recovery clean. For the combined effluent sample the post-recovery cleaning sample was taken following recovery cleans across all four trains within a two- week period, the most recent clean being 24 hours prior to sampling. LRVs were denoted as inequalities, i.e. greater than (>) a threshold value, where the measured permeate concentration was below the LoD.
For all MBR permeate samples the measured concentrations of viruses and protozoa were below the LoD, despite attempts to detect these microorganisms through sampling increased permeate volumes. LRVs were thus determined entirely by the influent pathogen concentration and the LoD of the analytical method. On this basis, ranges of paired LRVs for enterococci, Giardia, enterovirus and norovirus (all three types) were >3.4 to >6.7, >3.3 to >6.0, >3.9 to >8.7 and >2.7 to >7.7 respectively (Table 2). The corresponding mean LRVs based on unpaired data were >4.2 for Giardia, >8.2 for enterovirus and >6.5 for norovirus. The minimum LRV for Giardia, based on the highest detection limit concentration in the study, was >3.3 due to the lower sampled volume.
>>> View larger version of Disinfection capability of MBRs Table 2
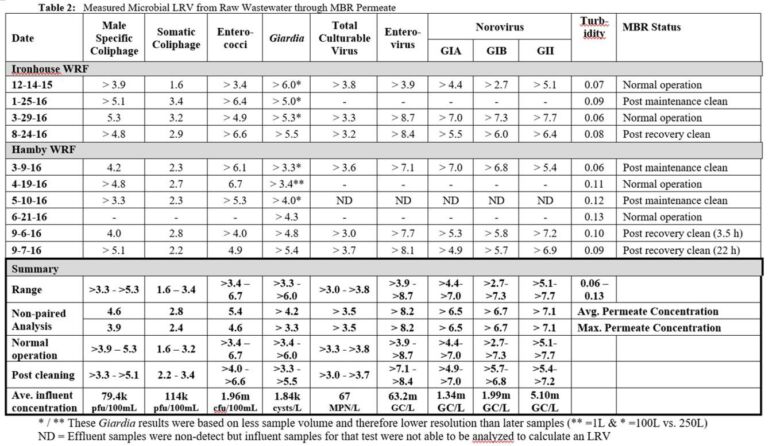
Additional tests on Giardia were conducted to determine the impact of the wastewater matrix on its recovery by seeding samples with known amounts of the microorganism. In the three samples analyzed the percentage recovery (i.e. the amount measured) of Giardia was between 3 and 54 % of the seeded concentration. It can thus be assumed that the actual influent Giardia concentration is between 2x and 20x higher than the analytical measurement, such that the LRVs given in Table 2 for this species are likely to be 0.5 to 1.5 lower than the real value.
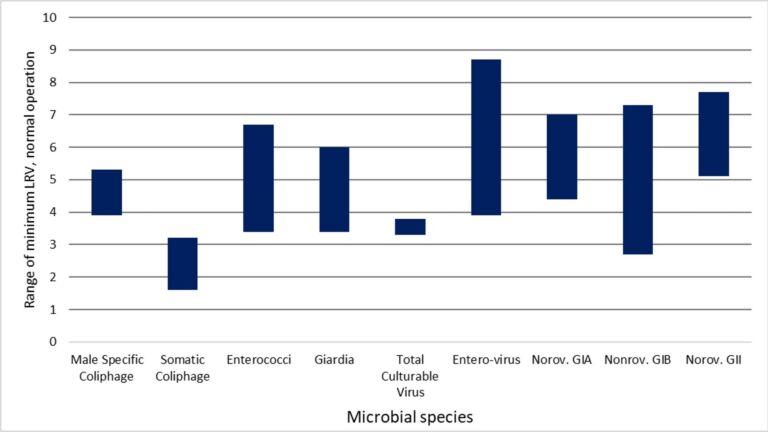
The study outcomes are in broad agreement with those reported by Ottoson et al. (2006), Hirani et al. (2017) and Branch et al. (2015), who found the LRV of microorganisms to be unaffected by prior chemical cleaning, as well as those of Purnell et al. (2016), Sima et al. (2011) and Simmons et al. (2011) who observed no substantial seasonal impacts on pathogen removal. The performance of the two facilities was similar, despite the Ironhouse facility having membranes that were several years older than those at Hamby, corroborating the findings of Nishimori et al. (2010) and Pettigrew et al. (2010).
Various surrogate parameters evaluated during the study, including particle size distribution (PSD), surrogate organisms, fluorescence spectroscopy and ATP analysis (Table 1) were found not to reflect microbial removal. This was due to the limited variation in effluent quality across all samples taken. A further study of the use of turbidity as a surrogate is reported elsewhere.
4. Regulatory implications of findings
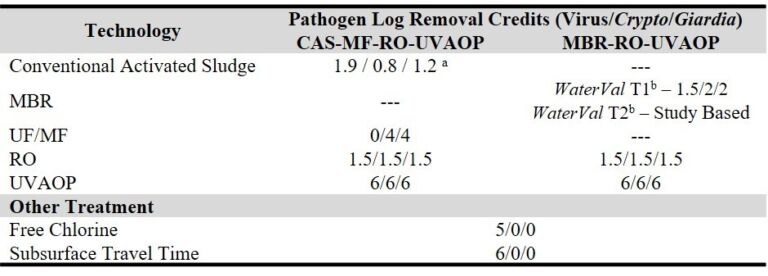
Clear regulatory guidance is essential for implementation of MBR technology in IPR/DPR applications. Current allowable credits for viruses and protozoa for various processes (Table 3) indicate widely varying values across the different technologies with implications regarding the required MBR performance. For example, meeting the minimum groundwater replenishment guidance in California, the minimum credit requirements for MBR in a flowsheet which includes MBR + RO + UVAOP is 2.5 for Cryptosporidium and Giardia.
The Australian-based WaterVal validation protocol seeks to provide consistent and robust national guidelines for MBR implementation while limiting public health risk through a two-tier approach:
- Tier 1: adoption of predefined conservative LRVs based on statistical analysis of historic MBR performance data and associated conditions, and
- Tier 2: conducting challenge tests under the most conservative expected operating conditions to determine minimum LRVs.
Tier 1 dictates that a <0.1 µm pore sized MBR operated within a certain envelope can be allocated a credit accordingly, as indicated in Table 3 (i.e. 1.5, 2 and 2 for viruses, Cryptosporidia and Giardia respectively). For Tier 2 the proposed monitoring is not based on a single monitoring parameter, but may employ turbidity to confirm membrane integrity and various operating parameters for biological treatment performance (WaterSecure, 2017).
Notwithstanding the WaterVal Tier 1 guideline values, data from the current study suggests a minimum credit of 3.3 and 2.7 for protozoa and viruses respectively could be adopted. These values arise from the following key outcomes:
- pathogen concentrations in all permeate samples were found to be below the limit of detection on the analytical methods employed;
- influent pathogen concentrations were shown to be affected by background interference, such that their influent concentration was likely to be higher than that recorded;
- for Giardia, the lowest LRVs were based on samples of lower volume and therefore higher detection limit concentrations.
The current exhaustive study found microorganisms to be non-detectable in all permeate samples taken, regardless of proximity to a chemical cleaning event, season or membrane age. Accordingly, the LRVs depended only on the feed microorganism concentration and, on this basis, exceeded 3.4, 3.3, 3.9 and 2.7 for the four respective species of enterococci, Giardia, enterovirus and norovirus.
However, in reality, the LRVs are likely to be significantly higher than these minimum values. MBR technology remains an option ideally suited to potable water reuse by virtue of its robustness to pathogen rejection.


