The MBR at Henriksdal: pilot and full-scale plant operation

Researchers at pilot-scale Hammarby Sjöstadsverk share their work in determining the operating conditions for Henriksdal WWTP in Stockholm, currently the largest MBR in Europe.
Sofia Lovisa Andersson (1), Sofia Andersson (2) and Christian Baresel (3)
(1) Stockholm Vatten och Avfall AB, 106 36 Stockholm, Sweden; (2) SWECO Environment, Box 340 44, 100 26 Stockholm, and (3) IVL Swedish Environmental Research Institute, Box 210 60, 100 31 Stockholm, Sweden
1. Pilot and full-scale plants
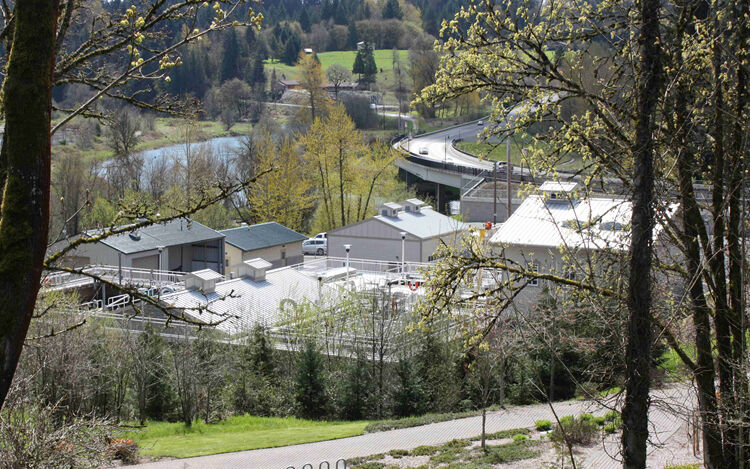
Over a nine-year period (2013−2022), membrane bioreactor (MBR) technology has been extensively evaluated through pilot testing at the R&D facility at Hammarby Sjöstadsverk prior to full-scale implementation at Henriksdal wastewater treatment plant (WWTP) in Stockholm in January 2021. The pilot plant is located on the premises of the treatment works, and the trials have provided great insight into the performance, operational challenges and benefits of the technology when challenged with the same wastewater as the full-scale installation under the same Nordic conditions. In addition, a large number of trials conducted to improve the resource efficiency of the MBR process have generated valuable new knowledge for the further development of MBR systems.
Alongside the extensive body of work at pilot scale, jointly conducted by IVL Swedish Environmental Research Institute and Stockholm Vatten och Avfall (SVOA), has been the experience and insight gained from operation of the full-scale plant.
2. The full-scale plant
Henriksdal WWTP in Stockholm is currently being extended and rebuilt to:
- increase its capacity, from 0.8 to 1.6 million PE, and
- improve the treated effluent quality to achieve water quality limits of 6 mg TN/L, 0.20 mg TP/L and 5 mg BOD7/L; the imposed maximum annual phosphorus emission of 27 tons implies even an lower water quality limit of 0.15 mg TP/L.
The reconstruction includes retrofitting of the existing conventional activated sludge (CAS) tanks with a new membrane bioreactor (MBR) process containing 1.6 million m2 of membrane area. It also includes extended pretreatment and an additional treatment step for thickening of the primary sludge. Digestion of thick sludge (~6% TS) will be conducted under thermophilic conditions, unlike today’s mesophilic operation, permitting high organic loads and relatively short retention times.
3. The pilot plant
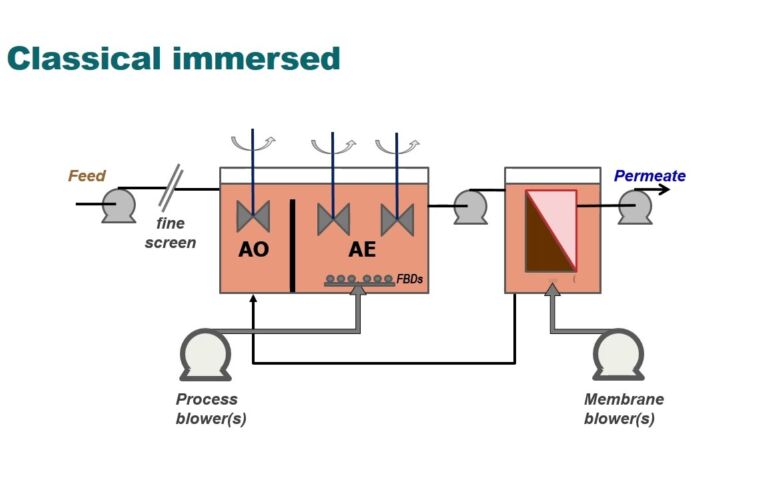
The MBR pilot was put into operation in 2013, but was subsequently modified to its current configuration. In 2016, the original flat sheet membranes were replaced, the configuration of the biological treatment modified, and a fine screen (2mm-rated) installed (Figs. 1−2). The pilot is fitted with the same hollow fibre membranes (Suez ZeeWeed 500D) as used in the full-scale plant, with two membrane tanks operating in parallel. Each tank contains one cassette with three modules (34.4 m2 per module) each. The biological treatment consists of pre- and post-denitrification through the addition of an external carbon source for nitrogen removal. Phosphorus removal is via precipitation at three dosing points:
- pre-precipitation upstream of the primary clarifier with ferric sulphate
- in-situ precipitation in the aerated zone with ferric sulphate, and
- additional dosing in the post-denitrification zone with ferric chloride when necessary.
In 2017 the MBR pilot was supplemented with a sludge treatment line to allow the study of different aspects of sludge handling.


4. Flow capacity and treated water quality
4.1 Flow capacity
The pilot has generally achieved stable permeate concentrations well below target at a lower dose rate of both the external organic carbon source and precipitation chemicals compared to design. The treatment capacity has also been well above design: the influent flow during 2021 was 4.1 m3/h, almost 37% above the design average flow of 3 m3/h.
4.2 Chemical dosing for nutrient removal
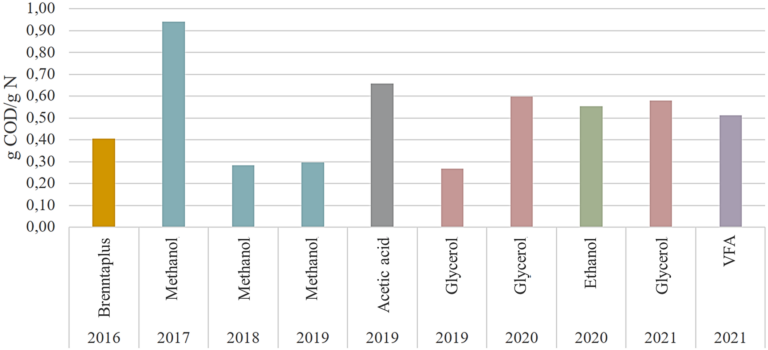
Methanol produced from natural gas, a fossil source, is the most common external carbon source used in Swedish WWTPs. Since decreasing the carbon footprint on the treatment process was a key project objective, the viabilty of other more sustainable carbon sources was studied. The denitrification efficacy of seven different external carbon sources in total was assessed (Fig. 3). Values were somewhat low due to the high degree of hydrolysis and endogenous denitrification. During 2021 a carbon source internally produced from sludge, volatile fatty acids (VFA), was tested for three months. The results obtained were comparable with those of glycerol and ethanol. The use of this internal source could reduce both the carbon dioxide footprint and the operational costs.
Ferric (PIX) salt was used to complement the ferrous sulphate (FeSO4) dosing for phosphorus precipitation up until the final year of the trial, when it was replaced by polyaluminium chloride (PAX). The study of different chemicals and dosing strategies allowed the selection of the most appropriate operational mode for the first MBR line in Henriksdal WWTP when it was put into operation in January 2021.
The yearly average effluent concentration of nitrogen (N) and phosphorus (P) differed from year to year, reaching 3.9 mg TN/L and 0.07 mg TP/L respectively in 2020 when the goal was to achieve the lowest effluent levels possible. The effluent requirements of <6 and 0.20 mg/L N and P (Table 1) were routinely met from 2017 onwards even under conditions of high loading associated with a 20% increased inflow during long-term trials. The optimal chemical dose concentrations were found to be:
- Coagulant dose for P removal: 8.6 g Fe2+/m3 and 0.9 g Al3+/m3
- Organic carbon dose for N removal: 17.3 g COD/m3 glycerol and 15.5 g COD/m3 VFA.
| Parameter | Limit | Period | 2016 | 2017 | 2018 | 2019 | 2020 | 2021 | 2022 |
|---|---|---|---|---|---|---|---|---|---|
| BOD7 | 5 | yearly average | < 2 | n.a. | n.a. | n.a. | n.a. | n.a. | < 2 |
| TN | 6 | yearly average | 4.6 | 4.8 | 4.6 | 4.4 | 3.9 | 3.9 | 4.8 |
| NH4-N | 2 | Apr−Oct average | 0.2 | 0.5 | 0.4 | 0.6 | 0.8 | 0.2 | - |
| TP | 0.2 | yearly average | 0.33 | 0.14 | 0.143 | 0.12 | 0.07 | 0.13 | 0.12 |
The coagulant consumption in 2021 was 1.29 mole metal per mole of phosphorus removed. This was slightly higher than those recorded for previous years, primarily due to a lower enhanced biological phosphorus removal (EBPR) activity in 2021. Whilst the process was not designed for EBPR, phosphorus release appeared to spontaneously take place in the anoxic zones – where nitrate levels were usually below 2 mg NO3-N/L − with phosphate uptake in the aerated zones. The iron and aluminium content in the activated sludge was 6.2 and 0.7 %, respectively. Average total solids retention time (SRT) during 2021 was 17.2 days and the average aerated SRT, the solids retention time in the aeration tank, was 7 days. Nitrification was always complete, with ammonia concentrations below 2 mg/L other than for a period of one week of the year when temperature decreased due to snow melting.
5. Membrane operation and performance
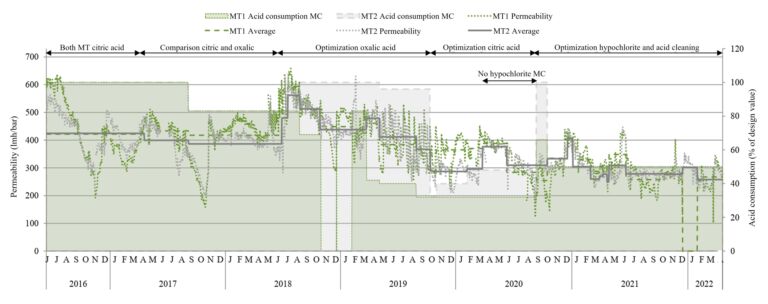
Generally, the membrane operation was stable with a permeability between 600 and 200 LMH/bar at a membrane air scour rate per cassette of 14 Nm3/h (0.136 Nm3/m2.h) under Leap-Lo (reduced air scour) conditions and 26 Nm3/h (0.252 Nm3/m2.h) for the Leap-Hi mode. Leap-Hi was only applied during high flows when the cake resistance exceeded a set-point, and was used less than 10% of the time. During the last year, Leap-Hi was successfully replaced with Leap-Medium (20 Nm3/h per membrane, 0.194 Nm3/m2.h) in a trial aimed at decreasing the energy consumption. The outcomes demonstrated a significantly increased efficiency and reduced energy consumption for membrane operation compared to the supplier's design recommendations.
Membrane fouling, with associated permeability reduction, was primarily by iron. Acid cleaning was therefore found to be most effective in maintaining membrane performance. According to the design, the membranes were to be chemically cleaned by:
- weekly back-pulsing with 2000 mg/L citric acid or 1300 mg/l oxalic acid, along with 200 mg/L sodium hypochlorite for maintenance cleaning, and
- twice-yearly soaking in chemical solution for recovery cleaning.
During trials conducted in 2017 the membranes in membrane tank 1 (MT1) were cleaned with oxalic acid and those in MT2 with citric acid for comparison, to supplement the cleaning by sodium hypochlorite. The results showed that the effect of cleaning with oxalic acid was at least as good as when cleaning with citric acid. Since oxalic acid is cheaper than citric acid a cost saving results from switching to the former. In addition, peaking of the permeate phosphorus concentration was observed following citric acid cleaning which was not evident when using oxalic acid.
Since 2018 the study has focused on optimisation of resource consumption associated with membrane operation, with trials investigating the impact of reducing the membrane air scouring as well as the chemicals demanded by membrane cleaning. This work has successfully demonstrated significant potential savings in both chemical and energy consumption during membrane operation, without impairing the membrane capacity. The trials have shown that a demand-driven approach to cleaning implementation, using a decision-making algorithm based on the measurement of the transmembrane pressure (TMP) rather than cleaning based purely on the permeate volume or elapsed time as recommended by the supplier, can lead to a 30−40% reduction in cleaning chemical consumption. The oxalic acid consumption could be reduced further over that of citric acid in comparison with the recommended design consumption without adversely affecting the membrane performance.
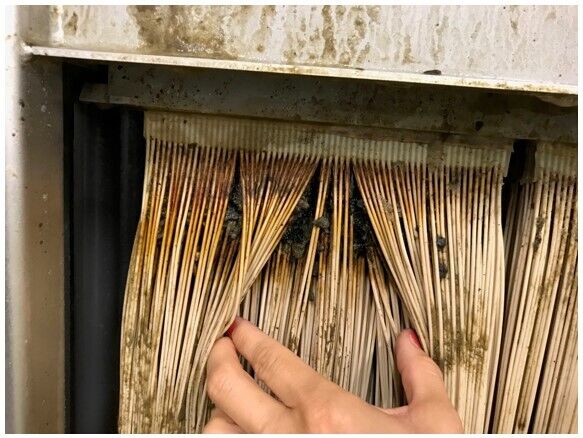
Whilst some agglomeration of solids (or 'sludging') of the membrane fibres was evident from visual inspection of the membrane after two years of operation (Fig. 4), the long-term decline in membrane permeability was small (Fig. 5). Moreover, no permanent adverse effect on permeability was observed during snowmelt or cold temperature tests.
None of the proposed parameters conventionally associated with membrane fouling, such as time to filter (TTF) or colloidal TOC (cTOC), have been used in assessing membrane performance since no clear relationship could be established between these parameters and permeability data from the MBR pilot.
Sludge recirculation through the membrane tanks for 10−15 minutes, corresponding to 2−3 residence times, was required following chemical cleaning prior to continuing permeate extraction to avoid temporarily elevated levels of organochlorine pollutants (AOX, EOX), chlorine, iron and phosphorus in the permeate.
Some more extreme challenge tests have been conducted to establish the robustness of the process. These have included:
- shutting down the relaxation part of the operating cycle for a 6-week period,
- excluding maintenance cleaning with sodium hypochlorite for a period of more than 4 months, and
- operating at the maximum design flux (>30 LMH) and increasing the elevated sludge concentration (>12,000 mg/L) by halving the return sludge flow ratio (to 2) for a few months (to reduce the pumping energy consumption).
In all cases, no significant long-term impact on membrane performance was observed.
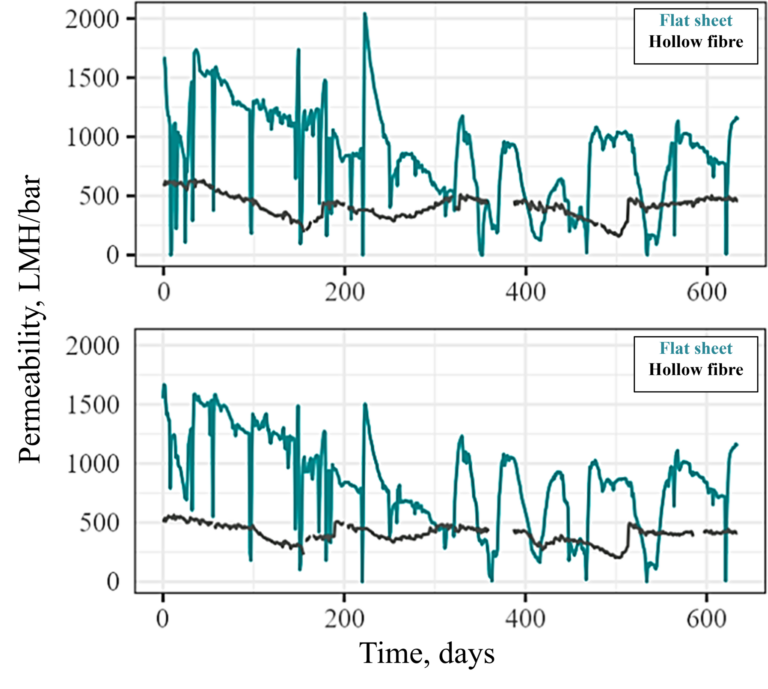
At full scale the membrane permeability during 2022 varied between 500 and 350 LMH/bar, employing a modified membrane cleaning protocol incurring a 60% and 81% reduction in the consumption of sodium hypochlorite and citric acid respectively compared to the design. Higher permeabilities (reflecting the lower TMPs) were recorded for the flat sheet membrane, as demonstrated by the first two years of the pilot plant operation (Fig. 6).
6. Other campaigns and trials
6.1 Micropollutant fate
A two-year study of the fate of micropollutants, including pharmaceutical residues, microplastics, bacteria, PFAS and chloro-organic halogens, was initiated in autumn 2017. It was concluded from this work that the concentrations of these micropollutants in the pilot MBR effluent and sludge were comparable with those recorded for the full-scale conventional activated sludge (CAS) process at Henriksdal WWTP over the same time period. Accordingly, it appears that neither the sludge nor treated effluent quality are significantly affected by the implementation of an MBR compared with the conventional process.
6.2 Volatile compounds
Emissions of chlorinated compounds in the off-gas ventilation were measured during a number of sodium hypochlorite recovery cleanings. The emission process was slower than expected and generally no clear sign of attenuation of emissions was observed during the 21 hours of sampling. Although composite samples of several hours during the night could not provide definitive evidence, it was postulated that the health impacts associated with emission arising during the entire recovery cleaning process may be of concern. The trichloramine concentration peaked at 36 times the recommended limit, chlorine gas at 73% of the short-term (15 min) exposure, and chloroform at 9% of the occupational exposure limit (8-hour workday average). These outcomes informed the design of the ventilation ducts at the full-scale installation, both to ensure operator health and safety and assess the corrosion risk to equipment placed in the ventilation ducts.
6.3 Greenhouse gases
To quantify greenhouse gas emissions, including nitrous oxide (N2O) and methane (CH4), three measurement campaigns in total were performed during 2014, 2018 and 2021. Generally, emission factors varied between 0.004–1.44 N2O-N/NH4-N and 0.026–0.63 CH4/TOC with the highest emissions observed in 2021. Very high membrane tank N2O emissions were recorded during 2021. No clear reason could be identified for this, although this elevation coincided with an increased incoming load (with an associated impairment of the effluent quality) and an improved sampling setup compared to 2014 and 2018.
6.4 Flux enhancing and foam reduction chemicals
In collaboration with Kemira, tests with a flux enhancer product were performed in 2021. No significant positive or negative change in permeability attributable to dosing of the chemical was evident from the continuously-monitored process parameters compared with the permeability variation associated with membrane cleaning.
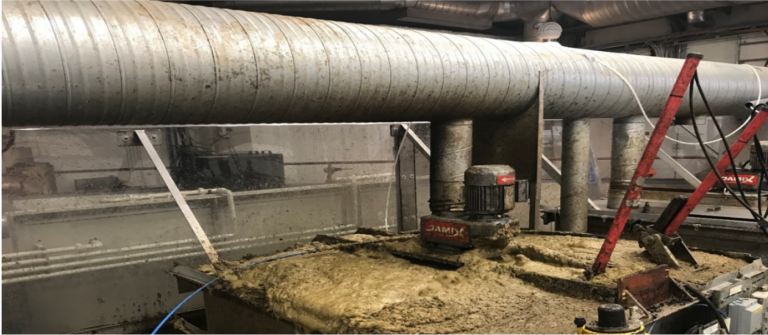
Since the formation of foam is a common phenomenon in MBR plants, tests with an antifoaming agent (SNF FloFoam H16) were conducted with both batch and continuous tests during a period of heavy foaming between March and June of 2021 (Fig. 7). Whilst foaming was always evident, control of foaming to a manageable level could be achieved with an optimal minimum continuous dose concentration of 10 mg/L. However, whilst demonstrating satisfactory foaming reduction the continuous dosing of this chemical in the full-scale plant may not be considered economically viable.
6.5 Sludge pumping energy reduction
The impact of halving the return sludge ratio (the membrane tank return activated sludge (RAS) flow: process flow ratio) from 4 to 2 on the membrane permeability was investigated over a seven-month period. The reduced recirculation increases the solids concentration in the membrane tank, increasing the risk of membrane surface fouling and channel clogging and consequently possibly increasing the membrane air scour demand and membrane cleaning frequency. However, no negative impacts of the reduced RAS flow on the membrane performance were observed over the duration of the trial.
7. Conclusions
The exhaustive trials conducted at the pilot plant at Henriksdal have successfully informed the key operational parameters currently employed for the full-scale installation – which remains currently the largest MBR plant in Europe. Significant improvements in energy and chemicals consumption over those arising from the design parameters have been attained. The pilot plant has been used for many other projects, including downstream advanced micropollutant removal, sensor development, digital twin modelling and direct potable reuse. The value provided by the pilot trials has almost certainly justified the expense of the investment in the pilot plant.


