A comparative techno-economic-environmental assessment of full-scale CAS vs MBR technologies

Giorgio Bertanzaa, Matteo Canatoa, Giuseppe Laerab, Mentore Vaccaria, Magdalena Svanströmc, Sara Heimerssonc
a Department of Civil, Environmental, Architectural Engineering and Mathematics, University of Brescia, via Branze 43, I-25123 Brescia, Italy
b CNR – Istituto di Ricerca sulle Acque, viale De Blasio 5, I-70132 Bari, Italy
c Division of Environmental Systems Analysis, Chalmers University of Technology, SE 412 96 Göteborg, Sweden
1. Introduction
Although a number of studies have compared the MBR system performance with that of the conventional activated sludge (CAS) process in treating municipal wastewater, none have attempted a simultaneous comparison of their environmental, techno-economic and social acceptance aspects.
In a recent collaborative paper by the University of Brescia, CNR, Istituto di Ricerca sulle Acque in Bari and the Chalmers University of Göteborg, these key aspects have been compared and quantified based on full-scale plant data from the 250,000 PE WWTP at Brescia-Verziano, which is fitted with both MBR and CAS lines.
2. The full scale WWTP
2.1 Plant configuration
The Brescia−Verziano facility in Northern Italy is one of the earliest examples of a large-scale municipal MBR WWTP installed internationally, with a nominal capacity of 250,000 PE evenly split between an MBR (in operation since 2000) and a CAS system. The common headworks comprises coarse (20 mm), fine (10 mm) and micro (2 mm) screens, with an aerated degritting channel and grease removal. Pre-treated wastewater is accumulated in an equalization basin before biological treatment. Both CAS and MBR lines are operated according to the modified Ludzack-Ettinger process scheme, while phosphorus removal is attained through alum dosing to meet the 1.0 mg P/L effluent standard.
The actual influent load is appreciably lower than the design load: the yearly average is 180,000 PE (110 gCOD/PE/d). The CAS and MBR lines are therefore operated at a low mixed-liquor suspended solids (MLSS) concentration of around 2.0 g/L and 5.2 g/L, respectively. The membrane is operated with 10s on, 30s off cyclic aeration (so-called '10/30 aeration'). Maintenance cleaning is conducted weekly using sodium hypochlorite and citric acid. The generated waste sludge is treated by thickening, mesophilic anaerobic digestion (AD), further gravity thickening and centrifugation prior to use in agriculture.
The raw data gathered during the day-to-day monitoring of the CAS and MBR trains (Table 1) were normalized so as to relate to an influent load of 180,000 PE to permit comparison of equally-sized plants with reference to mass balances, power and reagent consumption, and labour demand. The final disinfection stage (chlorination), by-passed in the real plant, was assumed to be normally operated, so as to achieve a comparable effluent microbiological quality for both technologies.
| Influent | Effluent − CAS | Effluent − MBR | ||
|---|---|---|---|---|
| Volatile Suspended Solids | [mg/L] | 183 | 17.8 | 1.0 |
| Total Suspended Solids | [mg/L] | 137 | 12.9 | 0.7 |
| Chemical Oxygen Demand | [mg/L] | 251 | 22.0 | 12.5 |
| Total Nitrogen | [mg/L] | 24.9 | 9.7 | 8.5 |
| Total Phosphorus | [mg/L] | 3.9 | 0.6 | 1.0 |
2.2 Mass and energy balance
Mass balances were conducted to track the flows of water, total and volatile suspended solids (TS and VSS), chemical oxygen demand (COD), total nitrogen (TN) and total phosphorus (TP), and also to take account of the distribution and fate of soluble and particulate fractions of COD, TN and TP. Each scenario included all water and sludge treatment operations, encompassing all return sludge and flows. The mass balance was then solved iteratively, until all data converged with a difference of <0.1% between two consecutive iterations. Reagent consumption was calculated for both plants based on (a) full-scale data for polyelectrolyte dosing for sludge dewatering, citric acid for membrane, and alum dosing for phosphorus precipitation, and (b) an assumed 10 mg/L sodium hypochlorite dose for treated wastewater disinfection for the CAS effluent.
The biogas generated by AD is fed to a boiler used for sludge heating, the excess biogas being flared. Since there are plans at the site to install a combined heat and power unit for improved energy recovery, the CHP unit was assumed to be in place. The biogas was then assumed partially distributed between the boiler and a CHP unit to ensure the digester thermal balance is maintained without the need to add fossil fuel. No internal usage of produced power was assumed, so as to take advantage of subsidies from feeding the renewable power to the grid. This affects the economy of the two scenarios but not the environmental impact. The overall yield for the CHP unit was assumed to be 75% (35% and 40% for electric energy and thermal energy yields respectively) and the boiler efficiency assumed to be 90%. Power consumption was taken from full-scale data itemised for water lifting, equalization, biological reactors and sludge processing.
2.3 Techno-economic-environmental assessment (TEEA)
Aspects of wastewater treatment include economic, environmental, technical, and social, with different stakeholders (politicians, plant managers, citizens, and authorities) often having conflicting objectives or criteria (cost, performance, and reliability/safety). Specific tools, typically developed in multiple-criteria decision analysis (MCDA), can be used to address different aspects to meet different objectives. Within the water sector, a cost-benefit analysis is explicitly required before new investments by the Water Framework Directive 2000/60/EC. However, other aspects also need to be taken into consideration besides technical aspects and/or costs, these two being the only ones normally considered, to ensure a more holistic approach usually associated with life cycle analysis.
The approach taken in the study involved grouping individual evaluation factors into five categories:
- technical aspects,
- administrative aspects/normative constraints,
- social aspects,
- economic aspects, and
- environmental aspects.
Each category consists of elementary attributes (or sub-categories); e.g. the technical aspects category encompassed the Reliability sub-category which included the three elementary attributes of:
- technology reliability (e.g. in relation to the variability of influent wastewater characteristics),
- number of full scale applications in EU, and
- measured range of variability of process performance under typical working conditions.
The elementary attributes could then be expressed either numerically (e.g. COD load) or qualitatively (e.g. low/medium/high reliability) and converted using a normalization algorithm, first into numbers (on a scale from 0 to 2) and then into corresponding 'traffic light' colours of red, yellow and green.
The final score for each studied technology was calculated by:
- scoring elementary attributes through the parameter normalization,
- calculation of the score of the upper levels (sub-category, if any, and category) by means of linear combination, and
- calculation of the final score as linear combination of the scores of each category.
Every category, sub-category and elementary attribute was weighted equally in the analysis.
Technical aspects and administrative/normative constraints were assessed from the WWTP manager’s viewpoint, such that some aspects could be given a negative technical score (e.g. if additional labour is required), but a positive score from environmental and/or economic impacts. For example, the additional production of electric energy or some other useful resource is advantageous economically but demands more effort and would thus be considered a technical drawback. Social aspects, on the other hand, were evaluated from the point of view of the local population, thus relating to public acceptance based on the perceived impacts.
The economic assessment, accounting for both capital (including such things as land acquisition and connection to services) and operating costs (CAPEX + OPEX), was performed by considering possible ranges resulting from variation of cost items. Two extremes of least and most favourable conditions were considered for maximum and minimum overall expenditure respectively. For the conversion of total costs into colours, green was attributed as a default value to the CAS system; MBR system costs exceeding 50% more than the CAS cost were depicted as red and 25−50% as yellow.
An LCA was conducted to assess the environmental impact according to ISO 14044:2006. The analysis encompassed the wastewater and sludge treatment, including membranes fabrication and supply, chemicals and energy use and production and sludge transport and end-use, but excluded the wastewater collection and construction of buildings and machinery.
The life cycle inventory was primarily based on the mass balance and energy calculations, with average Italian/European conditions assumed for electricity and consumables supply. Calculations were all based on a 180,000 PE influent load. Biogas production and the use of sludge for agriculture were accounted for through crediting the system for the avoided impact provided by these attributes, such as the displacing of commercial fertilizers, in keeping with ISO 14044:2006.
The current LCA was limited to assessing climate change (global warming potential, GWP), acidification (acidification potential, AP), freshwater, marine and terrestrial eutrophication (eutrophication potential, EP) and smog formation (photochemical oxidant formation potential, POFP). Results for each technology (MBR and CAS, respectively) were calculated and ultimately translated into colours for each impact category: the green colour being associated with the lower net impact, while a result of 10−30% higher than this baseline was attributed yellow and differences greater than 30% attributed red.
3. Results and Discussion
3.1 Mass and energy balances
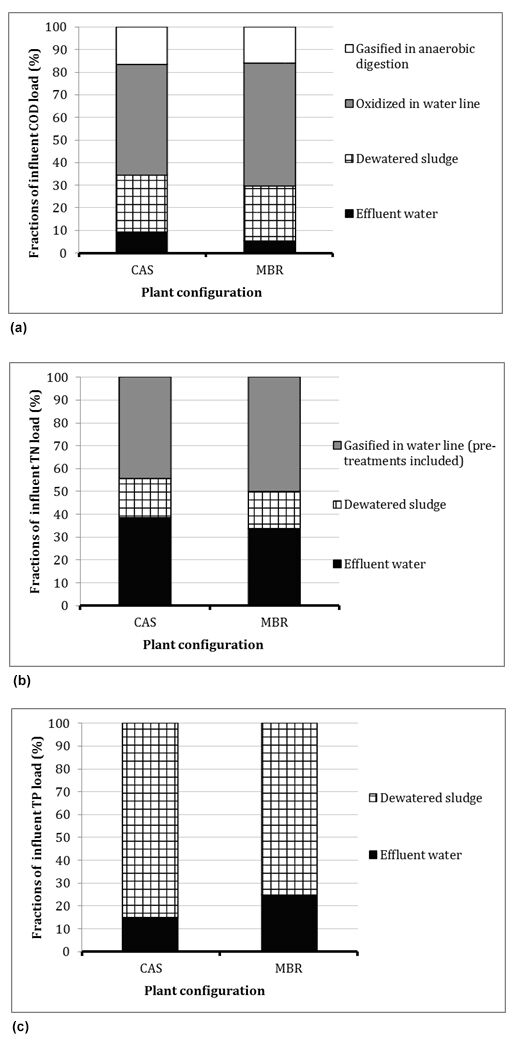
COD, N and P mass balances (Fig. 1) are similar for both plants, with just slightly greater (+5%) COD removal by the MBR system, in part associated with the expected lower SS content in the MBR effluent. The nitrogen mass balance is very similar for the two plants, with just slightly better effluent quality and a reduced nitrogen content in the excess sludge from the secondary tank for the MBR system (both in the range of 12−13% reduction in comparison with the CAS). This arises from improved nitrification/denitrification associated with the slightly higher sludge age and complete retention of the slow-growing nitrifying biomass and suspended organic nitrogen. For the MBR, residual inorganic P removal by alum dosing is limited by the maximum dose imposed by the risk of membrane clogging.
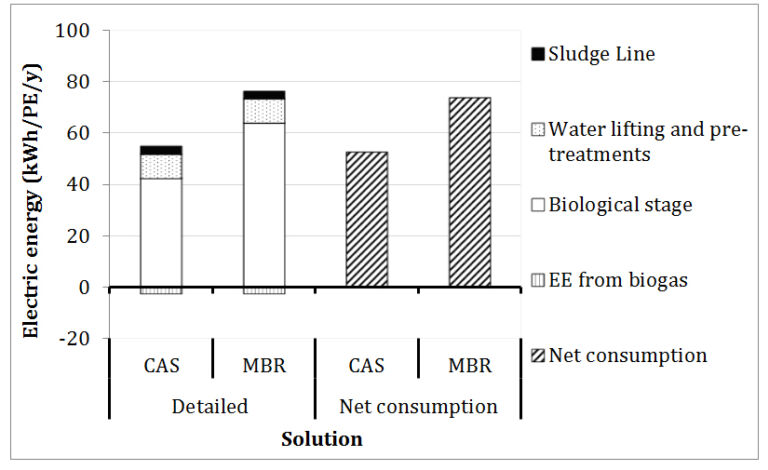
The electric energy balance (Fig. 2) indicates that, as expected, the MBR consumes more energy (73 kWh/PE/y) than the CAS (52 kWh/PE/y) due to the requirement for membrane air scouring. For both plants, only 35% of the produced biogas can be fed into the CHP unit, the other 65% demanded by digester heating, such that only 2.6 kWh/PE/y of electricity is generated by both plants. The net overall specific energy consumption values (0.34 and 0.48 kWh per m3 of treated water for CAS and MBR respectively) are within the lower limit of the ranges of corresponding values reported elsewhere. The values are much higher with reference to the influent organic load, due to significant infiltration of groundwater into the sewer which increases the wastewater volume. Whilst the overall specific energy consumption is 0.14 kWh/m3 higher for the MBR on the basis of the comparison made, supplementary tertiary filtration and disinfection of the CAS effluent would be required to provide treated water quality comparable to that of the MBR.
3.2 Techno-economic-environmental assessment and life cycle analysis
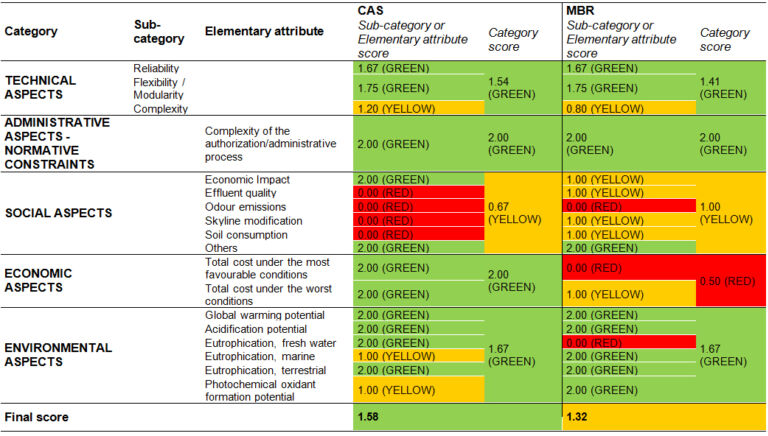
Results from the TEEA (Table 2) indicate that, apart from the economic and social aspects, the assessment of the two plants is similar and quite positive. The technical aspects indicate both plants (and in particular the MBR) to show a slight criticality (yellow) for Facility complexity. The two plants also have critical issues in terms of social aspects, though the overall evaluation of the MBR plant is more favourable due to the smaller occupied area (impacting on land area occupation and landscape impact). Whilst there is a positive impact on the local population of the MBR in terms of effluent quality, this is outweighed by the negative economic impact.
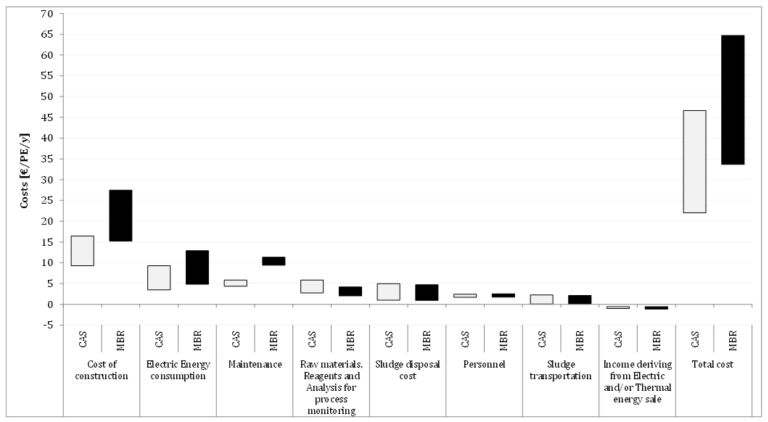
The economic assessment indicates the CAS to offer the lowest-cost solution (Fig. 3), the total cost (CAPEX+OPEX) of the MBR plant being 12−18 €/PE/y greater than that of the CAS. This corresponds to a cost increase of +53% under the most favourable conditions (i.e. when considering all costs at the lower value of the assumed range and all revenues at the higher) and +38% under the least favourable conditions.
The three items that have the greatest impact on the final outcome are:
- Cost of construction,
- Electric energy consumption and
- Maintenance.
Contrary to expectations, no difference in the cost of either sludge management (dewatering, transportation and disposal) or for personnel were evident from the analysis: the same number of operators are required for both plants, as demonstrated at the Brescia−Verziano WWTP site.
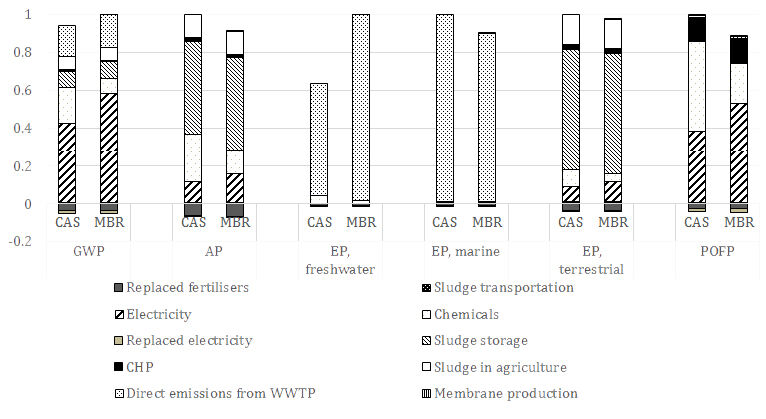
The LCA results (Fig. 4) show only minor differences between the two plants, other than the freshwater eutrophication potential of the MBR for which the effluent P is higher due to the constraint on alum dosing. This results from compensating effects.
For the climate impact, the higher electricity use by the MBR is almost compensated for by the decreased chemicals consumption. This also applies to acidification, terrestrial eutrophication and smog formation. Marine eutrophication results are dependent on N emissions in the effluent, which are lower for the MBR where N removal is greater.
In general, the large contributions relate to electricity use, sludge storage, the effluent and the use of sludge in agriculture. Against this, transportation, membrane production and replaced products have a minor contribution for all impact categories. Thus, the increased sludge generation by the CAS has little influence, neither for transportation nor for replaced products for the case considered (though this outcome is dependent on local conditions, such as the electricity supply).
Applying aggregation based on equal weighting, the CAS plant achieves a higher final score than the MBR for this case study based on the assumptions made (Table 2), primarily due to the higher cost of the MBR system, since the other categories yield similar scores for both plants.
Since technical, economic and environmental aspects are generally prioritised in the decision making process for environmental engineering applications, the CAS would be favoured over the MBR in this instance. However, the choice is strongly affected by the local conditions and the assumptions made. If, for instance, the area availability was crucial then within the sub-category Complexity this elementary attribute would be given much greater weighting, inverting the technical aspects score to favour the MBR. Similarly, the final score for the MBR technology could be higher if the overall weight of the category Social aspect were to be increased.
Applying weighting to the individual categories produces a final score F:
where:
T, A, S, C, E = scores calculated for the categories: Technical aspects, Administrative aspects, Social aspects, Economic aspects, Environmental aspects, and
t, a, s, c, e = weighting factors of the scores of the different categories (sum = 5).
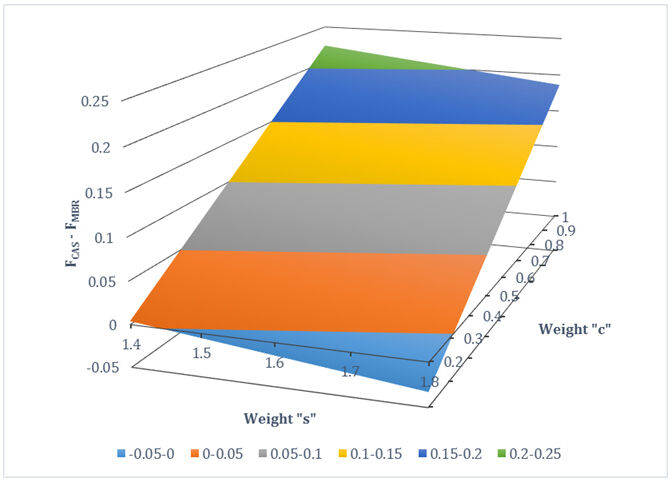
A sensitivity analysis focusing on the three categories for which major differences between the two technologies were observed allows the effect of changing their relative weighting on the final score to be assessed. The results (Fig. 5) were based on attributing a weighting of 1 to the Administrative and Environmental aspects (a = e = 1) for both technologies, and changing s and c as independent variables; t is then obtained by difference (t = 5 − c − s − a − e).
In particular, to emphasize the limit of preference for the CAS over the MBR (which incurs a higher cost but is more socially acceptable), the weighting factors s and c were respectively increased above and decreased below unity. The difference between the respective final scores of the two plants (FCAS− FMBR), reported as a function of weights s and c (Fig. 5), indicates that the MBR is preferable (FCAS− FMBR < 0) only when the Economic aspects are weighted low (c < 0.3) and conversely the Social aspects weighted high (s > 1.3).
Table 2: Results of the techno−economic−environmental assessment of the CAS and MBR plants: scores are obtained by attributing the same weight (1) to all categories. Scores range from 0 (worst ranking) to 2 (best ranking) (Bertanza et al, 2017).
4. Conclusions
The case study presented is based on an actual established MBR WWTP which retains a CAS line, allowing a comparison of the two technologies following normalisation. The analysis encompasses techno-economic, environmental and social impacts in a holistic assessment of the strengths and weaknesses of the MBR technology with respect to CAS, based on real data from the site.
In the specific case studied, the CAS technology is slightly preferred based on the power consumption (~20% lower for the CAS), total costs (38−53% higher for the MBR, depending on the market conditions), and process complexity (higher for the MBR). Against this, the social acceptance of the MBR is higher and the overall environmental footprint the same as the CAS, since the MBR plant has reduced chemicals usage that compensates for the higher power consumption. Moreover, whereas the effluent N content is lower for the MBR, the P content is increased due to assumptions made concerning alum dosing and membrane clogging, leading to a trade-off between freshwater and marine eutrophication.
While the outputs of the study are highly site-specific and are strongly affected by local conditions, the methodology can be generally applied to any scenario with modification of the weighting factors as appropriate. The method allows the classical techno-economic assessment approach to be extended to include social and environmental aspects and provide a more comprehensive analysis for improved decision making.


