Energy reduction at a large-scale MBR: the Nordkanal experience

C. Brepols, K. Drensla, A. Janot, and H. Schäfer
Erftverband, Am Erftverband 6, D-50126 Bergheim, Germany. Email: [email protected]
1. Introduction
Whilst changes to the design and operation of MBR membrane modules over the past 30 years have led to significantly improved energy efficiency, energy consumption remains the most significant cost and contributor to environmental impact during MBR operation. This relates mainly to the variations in feedwater flows, such that over-aeration of the membrane takes place at low flows.
The plant at Kaarst-Nordkanal has been in operation for 15 years. In addition to various process optimisation procedures, it was refurbished with a new anaerobic digestor (AD) in March 2019. So far, only a few MBR reference sites exist that use separate anaerobic biomass stabilization to generate electrical energy on-site instead of a more energy-consuming simultaneous aerobic stabilization. These installations result from MBRs implemented at wastewater treatment works (WwTW) with pre-existing ADs, as is the case for the MBRs installed at Rietliau WwTW in Wädenswil near Zurich and Traverse City WwTW in Michigan, US.
The following case study highlights the impact of on-site installation of an AD process on the key parameters of energy consumption and the associated greenhouse gas emissions. Outcomes may inform other full-scale MBR applications.
2. Case Study: Kaarst-Nordkanal MBR
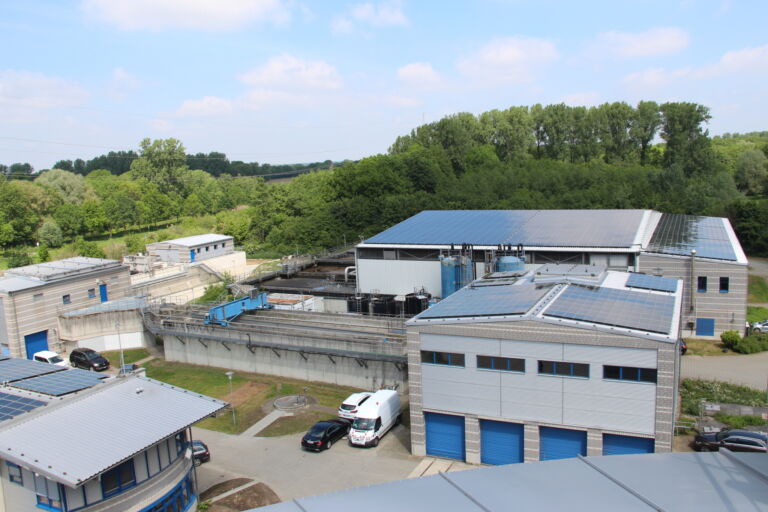
The MBR at Kaarst-Nordkanal is one of 36 municipal WwTWs operated under the authority of the Erftverband, a regional river water association located in the German federal state of North-Rhine Westphalia. In 2004 the MBR (Fig. 1) replaced an existing classical wastewater treatment process, while the plant site was moved 2.5 kilometres west from the existing facility to provide additional space and the opportunity for further municipal development.
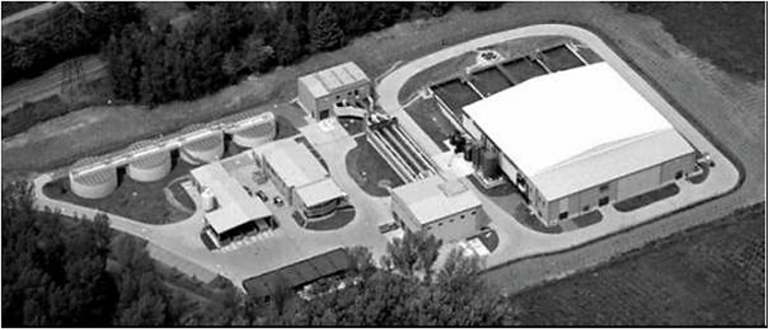
The catchment of the WwTW comprises three municipalities and an area of 1235 ha of paved surface with mixed-sewer systems. The MBR was designed to treat wastewater from up to 80,000 residents at a maximum storm weather flow of 45,000 m³/d. The biological treatment was originally designed for full biological nitrogen removal, simultaneous phosphorus precipitation and aerobic biomass stabilization.
The MBR is divided into four separate bioreactor lines, each one equipped with two lines of immersed hollow fibre membranes. At the time of commissioning, the Nordkanal MBR was the world’s largest MBR in terms of hydraulic treatment capacity.
The main priorities of process design and automation had been reliability of the membrane process separation and maintaining full operational capacity. However, it had to be recognised that this operational paradigm came at the expense of a low energy efficiency.
The maximum storm weather inflow of 45,000 m³/d is treated with all eight filter lines running at their full capacity while during dry-weather (which makes up more than 60% of the year) four or fewer filter lines provide sufficient hydraulic capacity. The previous energy inefficiency was caused by the energy consumed by the unused filter lines during the downtime. This effect was aggravated by the reduction in the average dry-weather inflow from the original design value of 16,000 m³/d to below 10,000 m³/d as a consequence of sewer rehabilitations in the catchment and diminishing domestic fresh-water consumption.
Initial efforts to reduce the energy consumption during dry-weather flows focused on filter operations, mechanical pre-treatment and biological process aeration. Annual electrical power consumption nonetheless remained above almost 5 million kWh/a until 2011. A major breakthrough was finally achieved in 2012, when the process automation of filters and bioreactors was renewed (Brepols, 2012; Drensla and Janot, 2017). In the same year, photovoltaic devices were installed on the plant roofing (Fig. 2).
By then, drastically increasing tariffs for electrical energy in Germany had already spurred further plans to refurbish the MBR with AD with on-site co-generation. Governmental initiatives to increase the resource efficiency of wastewater treatment paved the way to implement primary sedimentation along with sludge AD and a combined heat and power unit (CHP) for on-site energy recovery from the generated biogas. Initial proposals were issued in 2012/2013 (Brepols et al., 2013) and construction began in March 2017. The work was completed by the end of March 2019.
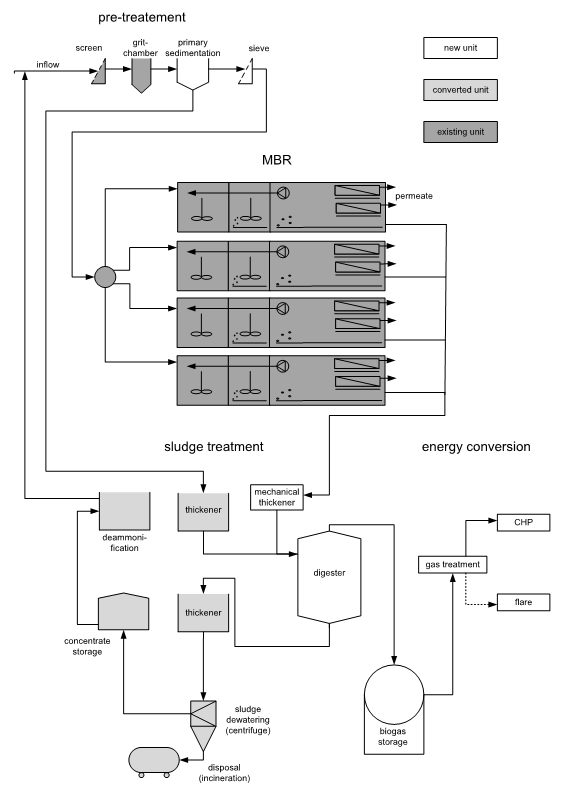
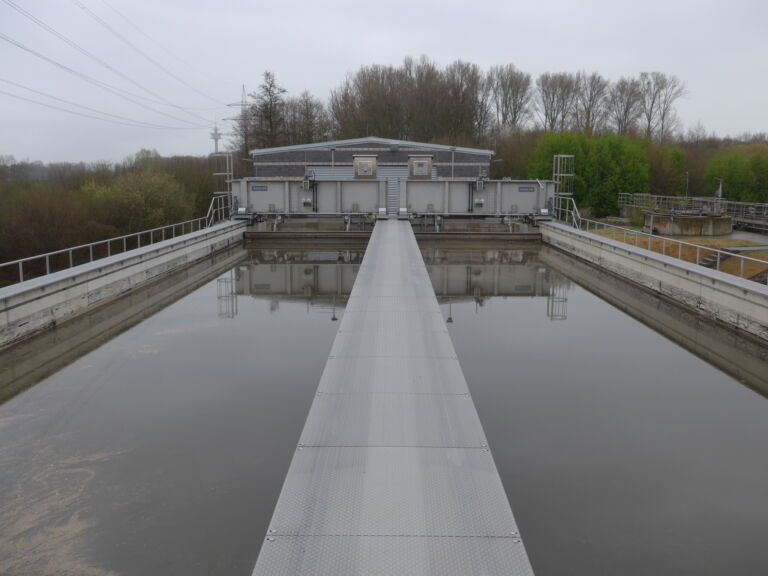
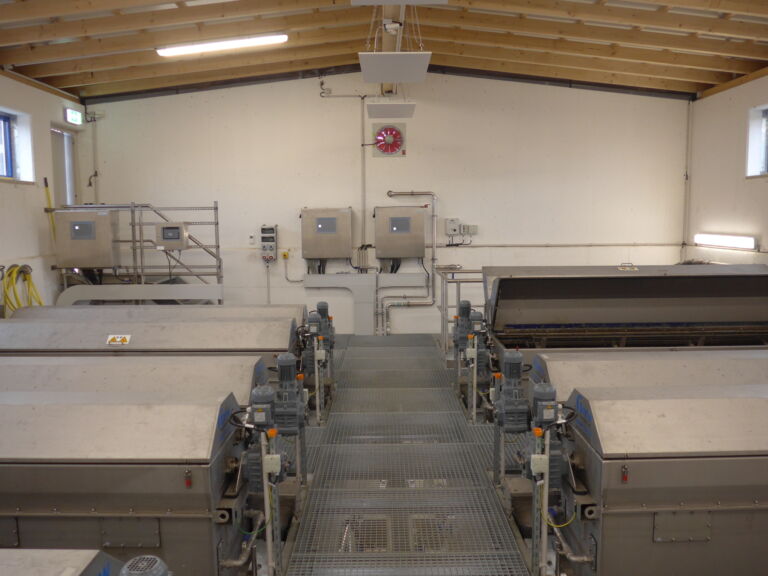
The new process layout of Nordkanal MBR (Fig. 3) consists of an inlet screen, a grit chamber, primary sedimentation (Fig 4a), fine screening over static perforated steel plates (contec screens, Fig. 4b) and the MBR process itself. Excess biomass is fed to a new mechanical belt thickener before entering the digester together with the primary sludge, which is pre-consolidated with a static thickener. Solids from the fine screen, which consist mainly of cellulose fibres, are treated and disposed of together with the dewatered anaerobic sludge.
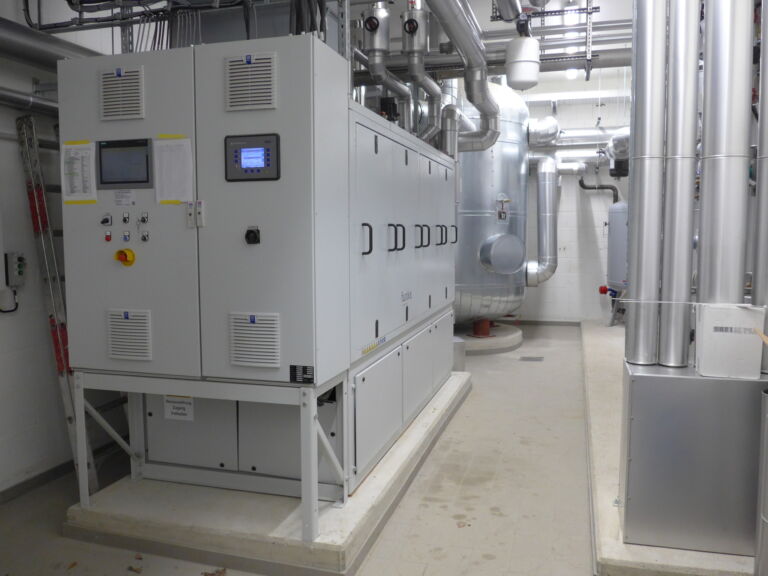
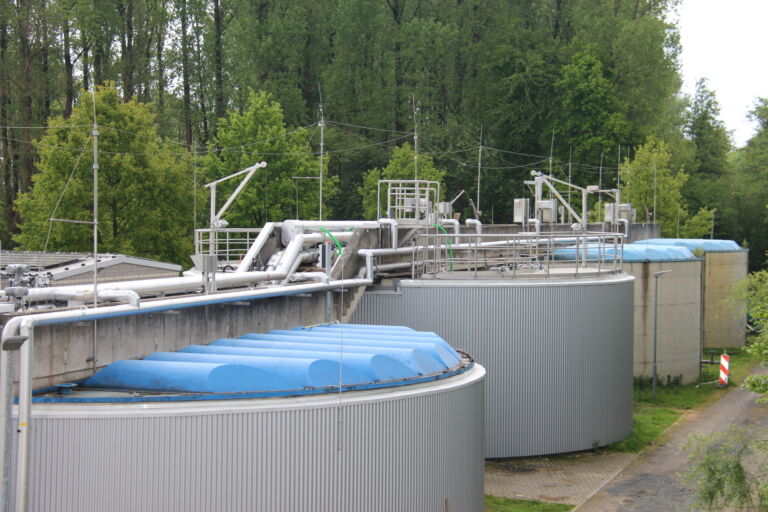
Biogas is stored, cleaned and converted into thermal and electrical energy at the new CHP unit (Fig. 4c). Ammonia-rich concentrate from the final sludge dewatering stage is treated separately by the Anammox process (Fig 4d) using converted sludge storage tanks, which reduces the nitrogen load to the main MBR. Key figures of the process units are listed in Table 1.
| Design (2004) | New (2019) | |
|---|---|---|
| Nominal design capacity, PE COD influent load, 85-percentile, kg/d | 80000 9600 (design) | 80000 12590 (measured) |
| Average inflow, m³/h | 650 | 580 |
| Primary sedimentation, Volume in m³ | - | 670 |
| Fine sieving | 0.5 mm wedge wire, 1.5 mm mesh wire (since 2006) | 1.5 mm punched hole |
| Bioreactor: | ||
| − Volume in m³ − MLSS concentration, g/L | 9300 12 | 9300 < 8 |
| Membrane filtration: − surface, m² | 84800 | 84800 |
| − peak flux set point , LMH − filtration/backwash time in sec − membrane air scour operational mode | < 25 400/50 10:10 | <40 900/50 10:30 |
| Digester volume in m³ Deammonification, Volume in m³ | - - | 2700 250 |
| CHP, power electric in kW | - | 300 |
| specific energy demand, total WWTP: | ||
| − kWh/m³ − kWh/a/PE | 0.97 65 | 0.65 40 |
| − kWh/kgCOD | 1.5 | 0.4 |
3. Results and Discussion
Figure 5 displays the annual influent flow and energy consumption from the first complete year of operation from 2005 onwards. After commissioning the MBR specific energy consumption remained relatively stable at a level between 0.9 and 1.0 kWh/m³ permeate. Encouraged by the experience and confidence gained in the operational stability of the filtration units, attempts were taken to divert from original operational set-points and improve the control strategies of both the biological treatment and the membrane filtration process.
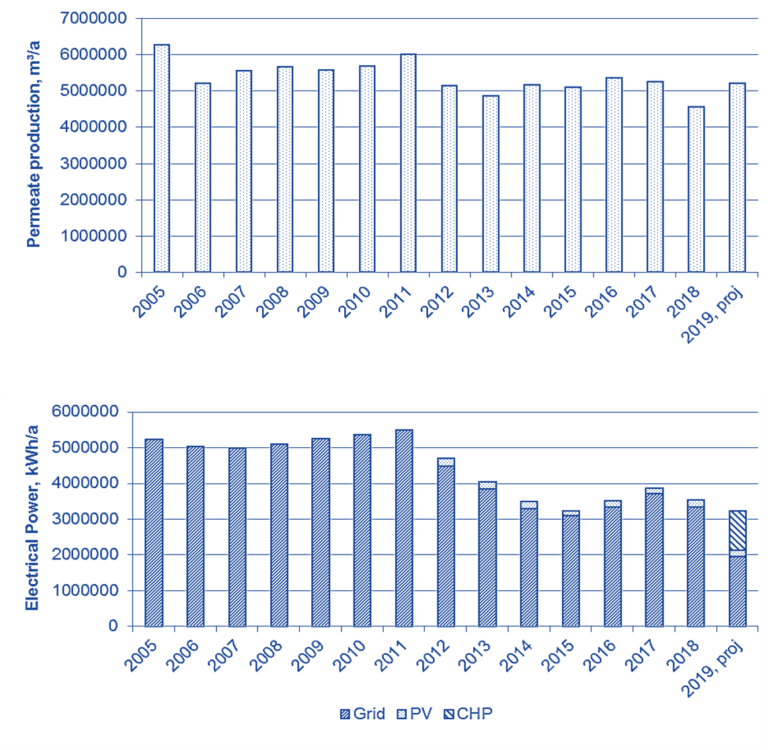
Although attempts at process optimisation began in 2010 it took almost two years before significant reductions could be achieved. Ultimately, though, the specific energy demand (SED) of the filtration process was decreased from 0.42 to 0.22 kWh/m3 − with the original membrane filters still in use. The SED of the entire plant was reduced from 0.93 in 2005 to 0.65 kWh/m3 in 2015.
Drensla and Janot (2016, 2017) have described a number of measures that were mainly responsible for this reduction:
- Increasing the instantaneous flux from 25 LMH to 30–40 LMH and the filtration interval from 600s to 900s, and employing frequent relaxation in place of backwashing, contributed to an increased net flux. Membrane air scour rates were reduced by changing to a new air-cycling mode (10:30 aeration), which required additional automatic valves.
- Operation of the bioreactors and filtration was further improved by channelling inflow to dedicated treatment lines to maximise the hydraulic load of the active lines. As a result, the active filtration lines operate at their optimal set-point while the remaining lines rest in a stand-by mode at a lower energy consumption.
- Bioreactor operation also contributed to energy savings. The MLSS concentration was decreased from its original design value of 12 g/L to below 8 g/L without any deleterious impact on the effluent quality. This reduction increased the aeration efficiency through enhancing the oxygen transfer efficiency, and reducing the oxygen demand for endogenous biomass respiration.
- Finally, replacement of inefficient equipment such as blowers, installation of additional measurement and control units, and subsequent re-programming of the existing SCADA system was carried out.
Due to construction works at the site and associated provisional states of operation the specific energy consumption increased in 2017 and 2018. During the start-up of the digester and the gas-processing equipment several minor problems occurred that for a while resulted in unstable operating conditions.
However, since the completion of construction the energy consumption has been significantly reduced. The CHP was commissioned in February 2019 and immediately produced up to 5000 kWh/d of renewable energy, displacing this electricity consumption from the public grid. The organic load to the bioreactor has been reduced by the new primary sedimentation stage.
Values for power production and consumption for the year 2019 are shown in Figure 6 based on initial operational data. Energy production by CHP accounts for one third of the total electrical energy consumed, while photovoltaic energy contributes 6% as a yearly average. The projected SED per capita for the new MBR process is at 40 kWh/a/PE. This compares to SED values for conventional WwTPs fitted with AD in Germany in the range of 10 to 85 kWh/a/PE, with a median value at 30 kWh/a/PE (DWA, 2015). These statistical values include data from WwTPs which generally have inferior effluent quality compared to an MBR.
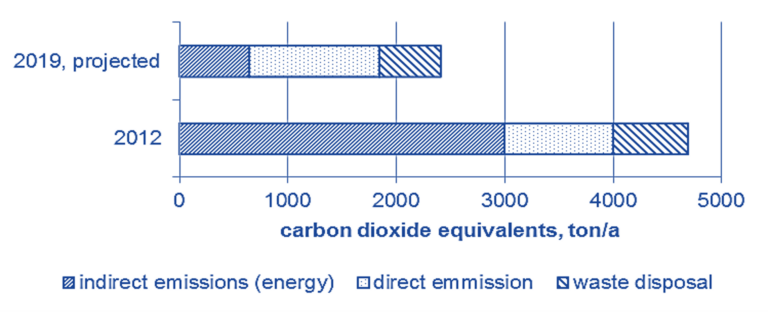
Greenhouse gas emissions of the refurbished plant have been estimated preliminarily based on assumptions from a previous research project (Genzowsky et al., 2013). Compared to values calculated for the year 2012 it can be seen that indirect emissions are significantly reduced. This is mainly a result of reduced electrical power consumption from the public grid.
Direct emissions from the process increase slightly as a consequence of emissions of methane from primary sedimentation and sludge digestion as well as the on-site conversion of biogas to power (Fig. 6). The converted digester gas is considered here as a renewable resource. A more precise estimation of GHG reductions is subject to an ongoing research project.
The start-up of the new AD will also be followed by a phase of further energetic assessments and improvements on site. At the same time, a research project at Nordkanal MBR is examining the interaction between PAC (powdered activated carbon) dosage and the filtration process. PAC reduces the micropollutant concentration in the effluent, but there are also indications that it may improve the filtration process by modifying the biomass and fouling properties.
Despite the considerable age of the membrane filters (over 17 years, based on the start-up date of September 2003), concentrations of pathogens in the permeate have remained stable and at a low level throughout the plant life. Moreover, compared to the effluent of conventional WwTPs and tertiary sand filters only very few micro plastic particles have been detected in the MBR effluent – reflecting the reported performance of MBRs elsewhere in this regard (Talvitie, 2018).
4. Conclusions
After several years of continued effort in improving process optimisation, the energy demand of the Nordkanal MBR has been significantly reduced while maintaining the high treated effluent quality. With the latest process improvement, the installation of an on-site anaerobic digestor, the calculated greenhouse emissions have been reduced by almost a factor of two from the 2012 levels. Currently, MBR technology seems to be the only technology capable of addressing the recognised key new challenges in municipal wastewater treatment in a single treatment step, these being micropollutant and microplastics removal and the containment of antibiotic resistant microbes.


