The MBR Site report: IWA World Water Congress & Exhibition 2018

1. About the IWA World Water Congress 2018
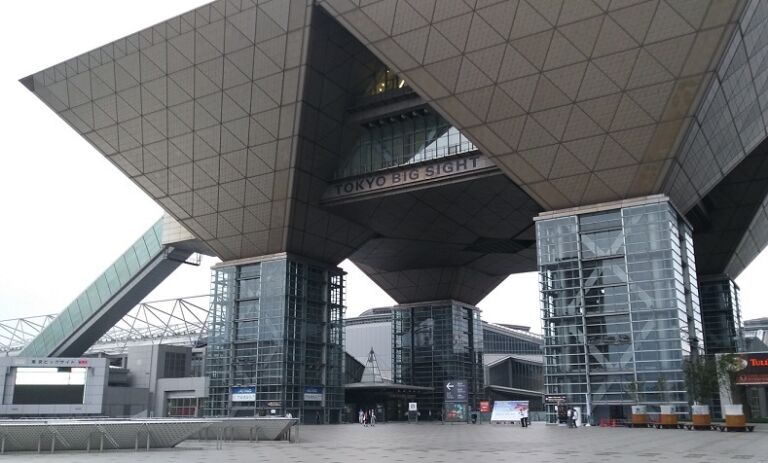
The 2018 International Water Association (IWA) World Water Congress was held 16−21 September at the Big Sight venue in Tokyo, Japan. Covering all aspects of water and wastewater treatment, the Congress held an academic session on membrane bioreactors amongst its 14 parallel trains over the four days, and a range of MBR companies took booths at the accompanying Exhibition. Over 400 posters included a number relating to membrane bioreactor technology, demonstrating a continued interest in research in this field.
There follows a summary of the MBR academic session presentations and a report on the Exhibition.
2. MBR academic session presentations
The MBR session comprised four presentations:
- Kyoko Yamashita (Japanese Sewage Works Agency) − 'Demonstration of energy-saving membrane bioreactor (MBR) systems'
- Tao Guihe (Public Utilities Board, Singapore) − 'Biosorption and low energy step-feed membrane bioreactor for water and resource recovery'
- Yuko Tsuzuki (Kubota Corporation) − 'Development of a new aeration control method for membrane bioreactor'
- Simon Judd (Judd & Judd Ltd/Cranfield University/Qatar University) − 'Sidestream vs immersed membrane bioreactors: a cost analysis'.
Three of the presentations focused on energy minimisation, quantified as the specific energy consumption SEC in kWh.m-3. Each had slightly a different slant on the subject, though all encompassed minimisation of membrane air scour in some way or other. All were based on full-scale membrane modules (either pilot or demonstration-scale studies) and all studies were conducted over a reasonably extended period of time.
2.1 'Demonstration of energy-saving membrane bioreactor (MBR) systems' − Kyoko Yamashita (Japanese Sewage Works Agency)
This piece of work had the stated objective of reducing the overall energy consumption of the process to below 0.4 kWh.m-3.
Four different commercial technologies (Table 1) were tested over a 12−18 month period, with operation including periods of peak fluxes of 2−3 times the average flux for four hours and 1.3−2.5 times the average flux for 24 hours.
| System: | A | B | C* | D | |
|---|---|---|---|---|---|
*encompassed flow equalisation **specific energy consumption. Recycle ratio of 2 for all systems | |||||
| Material: | Chlorinatedpolyethylene | Ceramic | Polyvinylidene fluoride | Polytetrafluoro-ethylene | |
| Shape: | Flat sheet | Flat sheet | Hollow fibre | Hollow fibre | |
| Nominal: pore size | 0.2 µm | 0.1 µm | 0.05 µm | 0.2 µm | |
| Mean daily flux, m.d-1 | 0.6 ± 150% | 0.54 ± 140% | 0.8 | 0.5 ± 140% | |
| SADm, Nm3.m-2.h-1 | 0.2 | 0.24 or 0.18 | 0.11 | 0.133 | |
| MLSS, g.L-1 | 10 | 8 | 8 | 9 | |
| Maintenance cleaning | None | Weekly | Weekly | Weekly | |
| SEC**, kWh.m-3 | 0.29 | 0.39 | 0.33 | 0.36 | |
For all four systems, all of which had upstream primary sedimentation followed by fine screening, operation was sustained at very low specific aeration demand values (SADm) of 0.11−0.2 Nm3. h-1 per m-2 membrane area, and mean fluxes ranging from 0.5 to 0.8 m.d-1 (21 to 33 L.m-2.h-1 or LMH). This then yielded SADp values in the region of 5−6 Nm3 scouring air per m3 permeate volume. The highest flux was sustained by the system (System C) encompassing equalisation to permit constant flux operation.
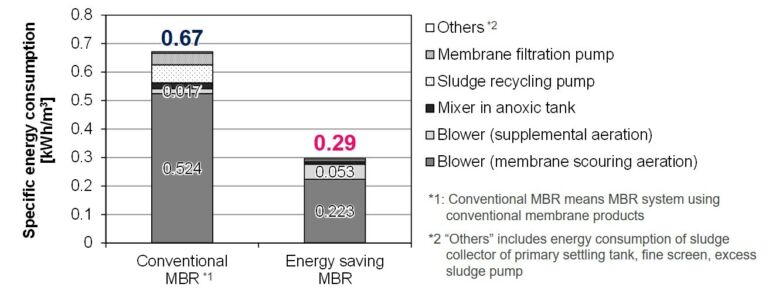
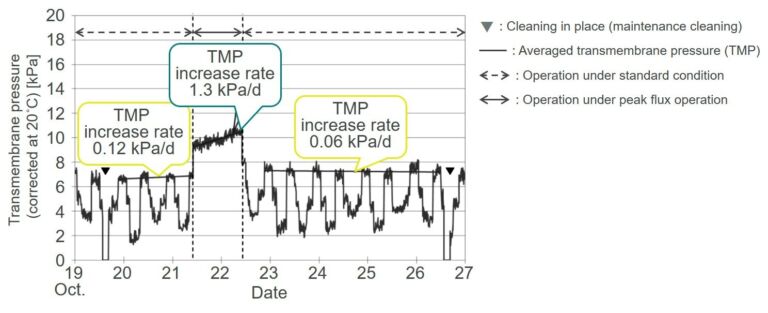
While the two flat sheet systems incurred a slightly higher SADm, the pumping energy for System A was almost eliminated by using syphoning (Fig. 1). For this system, the reduction in air scour combined with the pumping energy reduction resulted in a total energy saving of 43%, to a mean specific energy consumption (SEC) of 0.29 kWh.m-3. The SEC values for all other systems ranged from 0.33 to 0.39 kWh.m-3, with three of the four systems shown to recover from the peak flux conditions (Fig. 2). The objective of meeting an SEC of 0.4 kWh.m-3 was achieved in all cases.
2.2 'Biosorption and low energy step-feed membrane bioreactor for water and resource recovery' − Tao Guihe (Public Utilities Board, Singapore)
Tao Guihe reported on a 12,500 m3.d-1 average flow (18,750 m3.d-1 peak) demonstration plant − larger than the average pilot plant by some distance. A key feature of the process (Fig. 3) was the use of a 0.5 h HRT (hydraulic retention time) biosorption tank combined with lamella-plate clarifiers as enhanced primary treatment. This was placed downstream of the preliminary treatment of 5 mm screening and grit removal. The use of biosorption allowed a proportion of the organic load to be recovered and converted to biogas, increasing the overall process energy efficiency.
Following 2 mm fine screening, the wastewater entered a five step-feed bioreactor at an MLSS of 2−5 g.L-1 − a comparatively low concentration compared with a conventional MBR. The reactor operated at an HRT of five hours and a solids retention time of 5−10 days, conditions sufficient to allow effective biological process performance.
The mixed liquor was recirculated through the membrane tank at a rate of 1 Q. Even at this very low recirculation ratio (values of 4−5 are more typical), the concentration polarisation in the tank did not appear to cause operational problems. In fact, at the net operating flux of 20 LMH, the recorded SADp was only around 2 Nm3.m-3 − considerably lower than the values of 8−10 normally associated with a fully optimised classical immersed MBR (iMBR). Apparently, it was impossible to reduce the air scour further because the blower tripped, not being designed for such a significant turndown. It has to be assumed that the mixed liquor for this process was unusually benign.
At the very low SADp values sustained, the membrane air scour SEC was an extraordinarily low 0.042 kWh.m-3 − less than half that of the process aeration SEC of 0.108 kWh.m-3 and around one sixth that of the total recorded SEC of ~0.28 kWh.m-3 (Table 2). Further process optimisation of both the air scour and mixing reduced this figure to ~0.25 kWh.m-3. Because some of the organic material was recovered by the biosorption process and fed to the anaerobic digester along with the waste activated sludge, an estimated potential energy of at least 0.2 kWh.m-3 could be recovered from the waste. That leaves a calculated net SEC of below 0.1 kWh.m-3, making it perhaps the most potentially energy-efficient MBR process treatment scheme ever demonstrated.

| Items | Before | After |
|---|---|---|
| Bioreactor process blowers | 0.1084 | 0.1211 |
| Membrane air scouring | 0.0422 | 0.0394 |
| Air compressor | 0.0254 | 0.0237 |
| Membrane filtration | 0.0221 | 0.0206 |
| Bioreactor mixing | 0.0209 | 0.0048 |
| Biosorption process blower | 0.0133 | 0.0000 |
| Return activated sludge | 0.0130 | 0.0121 |
| ICA | 0.0119 | 0.0111 |
| Sludge transfer system | 0.0075 | 0.0070 |
| Service water | 0.0075 | 0.0070 |
| Biosorption mixing and recirculation | 0.0033 | 0.0031 |
| 5mm screens | 0.0020 | 0.0019 |
| 2mm screens | 0.0009 | 0.0008 |
| PST scum removal | 0.0007 | 0.0007 |
| Grit removal | 0.0004 | 0.0004 |
| TOTAL | 0.279 | 0.254 |
2.3 'Development of a new aeration control method for membrane bioreactor' − Yuko Tsuzuki (Kubota Corporation)
Yuko Tsuzuki of the Kubota Corporation, discussed the reduction of process aeration and membrane air scouring through monitoring and control. The biological process aeration was optimised through feedback control based on the ammonia concentration in the treated effluent. This datum was then used to control the dissolved oxygen level in the process tank, as determined through 'auxiliary' aeration.
The reduction in the membrane air scour demand was through monitoring of the transmembrane pressure (TMP). In this case, optimisation worked through applying an algorithm (based on a consideration of both cake filtration resistance and membrane pore clogging) used to predict an 'ideal' rate of increase of TMP:
where A(X) is an empirical parameter based on the values of key operating variables such as the flux, aeration and MLSS concentration, and Y is the hydraulic resistance (the TMP divided by the flux) at time t. k0 is then a second empirical parameter which defines the steepness of the curve.
The algorithm is applied to the baseline TMP attained following a chemical clean to predict the TMP (Fig. 4).
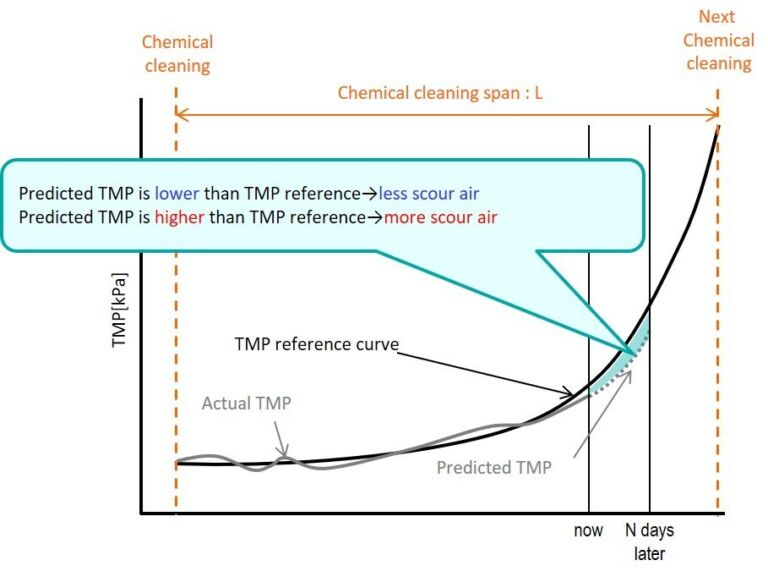
The rate at which the actual TMP increases may then either be less than, the same as, or greater than the predicted TMP. If less than the predicted rate, then the air scour can be reduced and, if more than, it is increased. The TMP transient can be adjusted so that the threshold TMP at which the chemical clean is applied is roughly the same each time. If the extent of fouling can be controlled in this way then the effectiveness of the chemical clean is increased.
The key to the success of the optimisation process is the accuracy of the empirical parameters contributing to X, the initial values of which have been identified by applying partial least squares (PLS) regression analysis to historical data. An example of a data set shows it to be very accurate in representing the TMP trend (Fig. 5).

The application of the optimisation technique to the Moriyama demonstration sewage treatment works in Nagoya has shown that the scouring air can be reduced by 21% compared with conventional constant-flow operation. The use of ammonia concentration for feedback control provides a reduction of 17.5% in the dissolved oxygen requirement without significantly impacting on the treated water quality. Overall, when optimised for both process and membrane aeration, the resultant energy demand for the full-scale plant was 0.22 kWh.m-3.
2.4 'Sidestream vs immersed membrane bioreactors: a cost analysis' − Simon Judd (Judd & Judd Ltd/Cranfield University/Qatar University)
The previous studies all demonstrate the scope for energy optimisation in MBRs, this often being identified as a major contributing factor to limiting their implementation. The final presentation of the session, a cost analysis by Simon Judd, demonstrated the often overlooked cost contribution of staff effort.
According to this analysis, labour costs for small installation (500−5,000 m3.d-1 flow capacity) make up 63−79% of the operating cost (Fig. 6) − significantly more than the energy costs even for a non-optimised MBR.
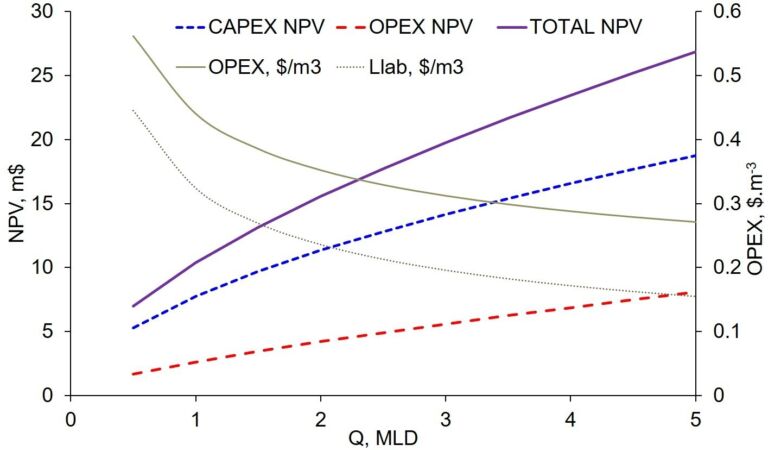
This analysis seems to underline the importance of process robustness. Interruptions to routine operation of the process can greatly increase the number of staff assigned to the installation, incurring a significant cost. While increases in energy efficiency are always welcome, it must never be to the detriment of the safe and trouble-free running of the process.
3. The IWA Exhibition, Tokyo
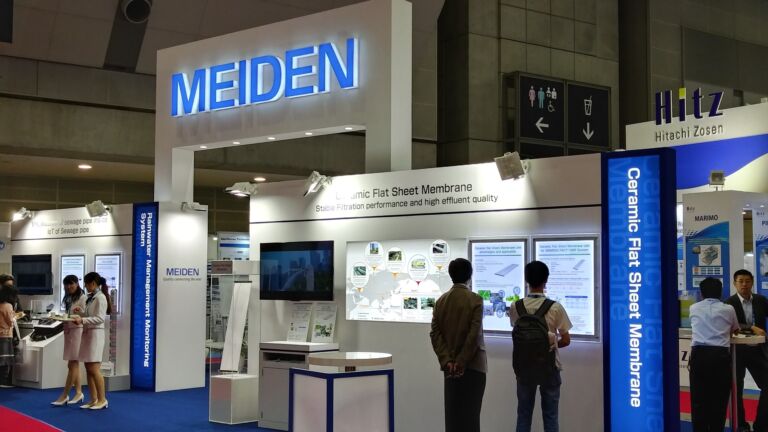
Alongside the 14 parallel academic sessions, the Exhibition was a great opportunity to meet both new and established MBR technology suppliers. Many of the major organisations were represented, including SUEZ, Kubota and Mitsubishi Chemical Aqua Solutions, Ecologix, Pentair and Meidensha Corporation, and the Japan Pavilion was a great opportunity to network with local organisations.
