At what cost? MBR capital and operating expenditure − the impact of labour

Simon Judd, Judd Water & Wastewater Consultants
It's often assumed that the main cost associated with operating a membrane separation plant relates to the energy consumption, followed by the membrane replacement. Consequently, considerable efforts have been devoted to fouling control and mitigation, with more than one fifth of all MBR research literature publications devoted to this topic (Judd, 2017).
The reasoning is simple: reducing the transmembrane pressure reduces the energy demand − there is direct proportionality. Alternatively, increasing the flux reduces the membrane area requirement, and so the membrane replacement cost. Lastly, reducing the fouling rate reduces the cleaning frequency and the associated downtime (as well as chemicals consumption and waste generation). So, fouling mitigation is obviously A Good Thing.
It also stands to reason that membrane replacement costs can be reduced by fabricating cheaper membranes and/or extending membrane life. There is certainly a dearth of knowledge regarding the factors determining membrane life (though there has been recent progress in this area − see our recent blog post on membrane ageing), especially when compared with the much more widely explored subject of fouling. But there are plenty of people trying to produce better-performing membranes, and the cost of commercially-available membranes has tended to decrease over the past two to three decades.
But here’s the thing. The main contribution to the total expenditure (TOTEX) of a membrane installation is normally the capital (or investment) expenditure (CAPEX). Although the membrane cost contributes significantly to this, it is by no means the only CAPEX component. The CAPEX is then added to the operating expenditure (OPEX) incurred over the life of the plant to produce the TOTEX. And the OPEX is normally discounted by 3−8% per year to allow for the change in the real value of money with time.
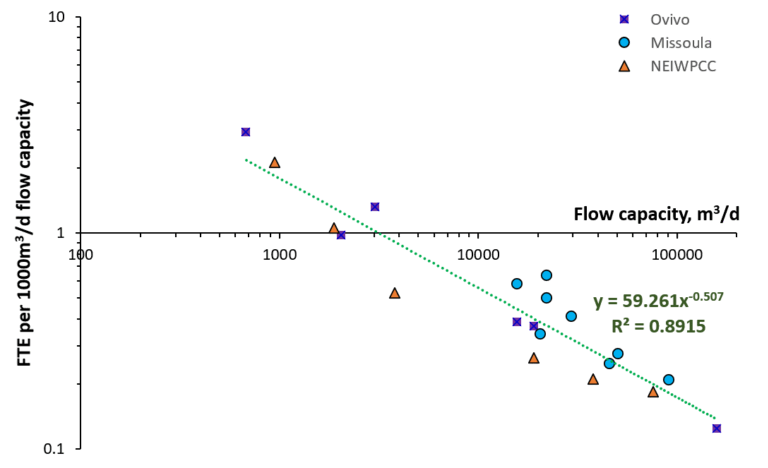
Also, as recently revealed in an analysis by Qiblawey and Judd (2019), and pretty much confirming earlier studies by Young et al. (2013) and Cashman et al. (2016), labour costs can be as significant as both membrane replacement and energy consumption. Based on data taken from three different US sources, these authors determined the staff effort in terms of full-time equivalents (FTEs) and normalised the flow capacity Q in megalitres per day (MLD) to follow a power law (Fig. 1):
The above expression implies that the staff effort required to operate an MBR increases from 1.8 FTE (full time equivalent) for a 1 MLD (megalitres/d) plant to around 20 for a 100 MLD plant. The normalised staff effort, i.e. the cost per unit volume of treated water, thereby decreases by more than an order of magnitude from 1.8 and 0.17 FTE per MLD flow (Fig. 1). The corresponding specific labour cost, based on a rate of pay of $30/h, is then $0.43 per m3 permeate at 1 MLD, cf. 0.041 at 100 MLD flow capacity.
This demonstrates that, whereas the other specific OPEX contributions (as cost per unit volume treated permeate) change little with plant size, the labour specific OPEX becomes significant at low plant flow capacities.
For a 1 MLD plant, halving the staff effort saves almost $0.22/m3. If this happens every year for 20 years then the total saving would be $1.2m, allowing for discounting at 3% per annum. So, an additional capital investment of up to $1.2m for a plant of this size would be cost neutral provided it halves the labour effort over the course of two decades.
As far as the capital cost is concerned, expressions are available or obtainable (Table 1) for the specific CAPEX as a power function of Q:
| Cost component | a | b | R2 | Flow range, MLD | Reference |
|---|---|---|---|---|---|
*Average of three reported trends | |||||
| CAPEX, L’c | 5.11 | –0.0796 | 0.94 | 2–36 | Guo et al., 2014 |
| CAPEX, L’c | 167 | –0.462 | –* | 0.5–50 | Jalab et al., 2019 |
| Labour exp, L’l | 70 | –0.507 | 0.89 | 0.5–150 | Qiblawey and Judd, 2019 |
The investment cost for a plant of 1 MLD flow capacity would be somewhere between $2.9m and $6.9m, according to the respective analyses of Guo et al. (2014) and Jalab et al. (2019). So, the supplementary $1.2m equates to 18−41% of the CAPEX at this flow capacity. The nature of the labour effort trend depicted in Fig. 1 means that the proportion of the total expenditure provided by the labour cost decreases significantly with plant size for the Guo et al. CAPEX trend (Fig. 2), but not so much for the Jalab et al. trend. In the case of the Jalab et al. data, the value of the exponent b for the CAPEX curve is similar to that of the labour trend (0.51 vs. 0.46), such that the labour cost is still significant (25% of the CAPEX value) for a 100 MLD capacity plant.
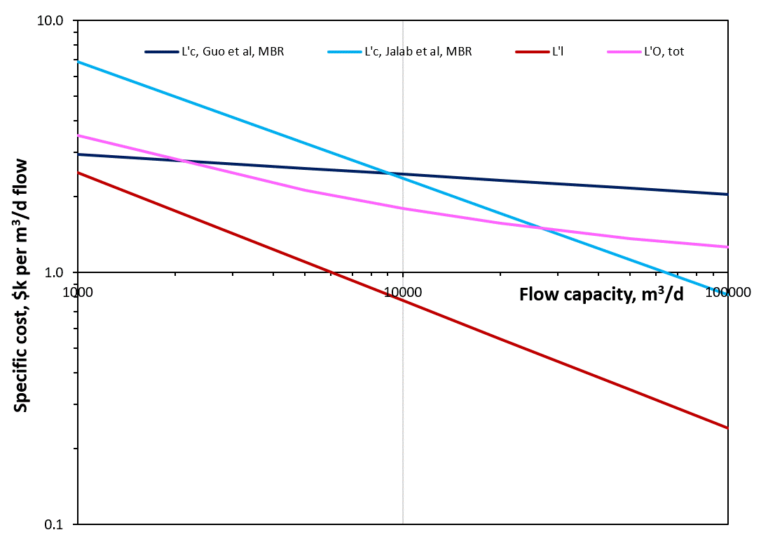
Not for the first time, then, there is a balance between CAPEX and OPEX. As with all empirical analyses of this type, the quantitative results are heavily influenced by the assumptions made. For instance, the analysis ignores any possible impact of a change in the plant design on other elements of the OPEX such as the energy consumption. It also ignores the impact of changes in labour cost with time.
It should also be acknowledged that the empirical relationship for the assignment of labour effort (Equation 1), generated from the data shown in Figure 1, may not be generally applicable. But even if it is 50% out, the specific labour costs for a 1 MLD capacity plant would still exceed all other OPEX components combined, which come to around $0.18/m3 assuming an energy cost of $0.15/kWh. By the same token, the specific cost of labour for very large plants (100 MLD or more) is unlikely to make up more than ~15% of the total specific OPEX based on this approach.
The analysis does at least semi-quantify the impact of labour effort and demonstrate the possible extent of the impact of process upsets incurring unscheduled manual intervention on the overall costs. There is a growing realisation that most plant upsets demanding such manual intervention, resulting in increased OPEX, are due to rather mundane things like mechanical failure (of pumps, blowers and, in particular, valves and actuators), foaming and membrane channel clogging (Table 2).
| Type of event | Event manifestation and remedial measures needed | Plant modification to reduce risk |
|---|---|---|
| Foaming ('moussing') | Formation of stable, biological foam due to excessive levels of filamentous bacteria | Load equalisation to reduce fluctuations in COD and nutrient concentrations. Enhanced pretreatment for FOG removal, if relevant. |
| Breaching (loss of membrane integrity) | Breakthrough of contaminants into product water, especially pathogenic bacteria | Flow equalisation to reduce hydraulic shocks. Enhanced degritting to reduce risk of damage to membrane by hard, sharp particles. Increased membrane area to reduce flux, and so operate under more benign conditions. |
| Clogging (filling of membrane channels with solids | Ineffective chemical cleaning | Upgrading of fine screen. Screening of the return activated sludge (RAS) line. Flow equalisation to reduce hydraulic shocks. |
Invest in decent mechanical equipment, screens and, if possible, provide equalisation of the flows and loads and a lot of the risks of process upset are likely to be reduced. But, of course, no amount of investment can ever guarantee that process upsets will not take place. The most significant parameter is uncertainty.


