Foaming in MBRs: measurement and evaluation

Gaetano Di Bella1 and Michele Torregrossa2
1 Facoltà di Ingegneria e Architettura dell’Università Kore di Enna, Cittadella Universitaria, 94100 Enna, Italy
2 Dipartimento di Ingegneria Civile, Ambientale, Aerospaziale, dei Materiali, Università di Palermo, Italy
1. Introduction
Foaming of conventional activated sludge (CAS) is very common. It may happen during start-up due to the presence of surfactants, with insufficient biomass to degrade them during the early stages. However, this is normally a short-term issue. These foams (from surfactant foaming) are mostly white and can be countered with anti-foamants until there are sufficient biomass developed to degrade them. However, foam formation can occur during normal operation when the activated sludge is fully developed. In such cases a stable brown foam forms due to excess of hydrophobic filamentous micro-organisms (Nocardia, Microthrix parvicella and others). Such foams (from biological foaming) are widely reported and are more onerous than surfactant foams.
In MBR plants, contrary to CAS plants, the formation of stable brown foams has been observed both in the presence and absence of filamentous micro-organisms. This is curious, since MBR and CAS both form biomass (or sludge) from the feedwater in the same way. The agents causing foaming are the same for both systems: they are surfactants generated from bacteria. The bacteria release these chemicals (generally referred to as extracellular polymeric substances, EPS) in stressful operative conditions. However, MBR plants retain more of the EPS than do CAS plants. On the other hand, foam-forming micro-organisms appear to be less prevalent in MBR foams. It thus seems that MBR foaming is largely due to the retention of excessive amounts of EPS, rather than directly from foam forming micro-organisms, and could therefore be termed EPS-foaming.
In general, without surface wasting of floating sludge, foaming in MBR systems causes the same adverse effects as for CAS ones:
- the trapping of significant quantities of mixed liquor suspended solids (MLSS) within the foam makes the solids retention time (SRT) more difficult to estimate and control
- in warm climates, the foam decays rapidly, producing a foul smell
- if the production of foam is not curtailed, the foam can overflow the basin freeboard, covering walkways, handrails, surrounding areas, creating hazardous conditions.
It is the third of these that creates the most serious problem and demands an understanding of foaming, its causes, methods of measurement and assessment, and ultimately its prevention.
2. Foaming test
The identification of foaming factors in a biological tank requires accurate analysis. Although hydrophobic bacteria have been assumed to play an essential role in foam formation and stabilisation in CAS plants, in an MBR system the quality and quantity of foam is strongly influenced by the complexity of the activated sludge microbial population and by the high EPS concentration in the aerobic tank. This complicates the immediate evaluation of sludge foaming ability and consequently, identifying the correct remedial measures. Proposed foam tests and analysis can be categorised as:
- Quality test: Foaming rate and foam power
- Quantity test: Modified Scum Index and surface coverage
- Microscopic observation: Filamentous bacteria identification and abundance.
2.1 Quality test
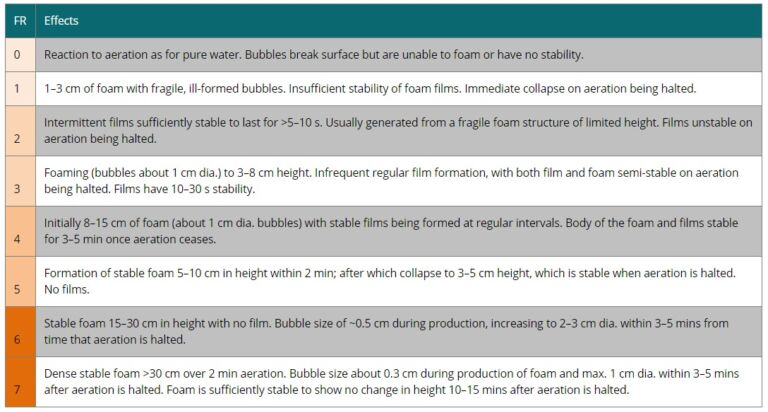
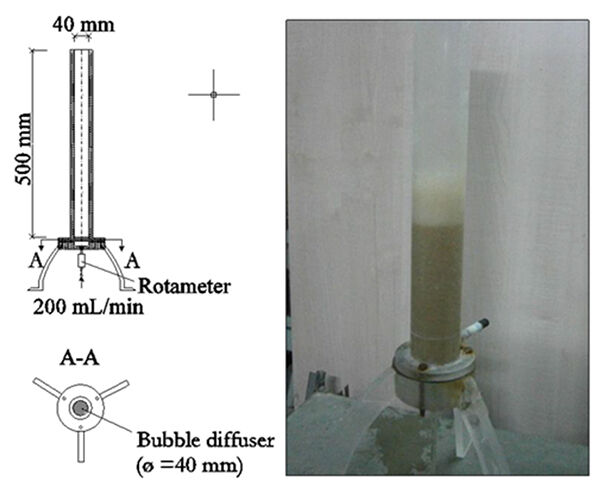
Generally, foam quality is measured on site by means of a specific apparatus. To define the foam stability and 'geometric' characteristics (thickness and features), the Foaming Rate (FR) is used according to Blackall’s method (Blackall et al, 1991). The FR value is measured by pouring 50 mL of activated sludge into a 40 mm dia x 500 mm high glass cylinder and bubbling gas through it via a 40−90 µm pore size diffuser at 200 mL min-1 (Figure 1). Foam characteristics are recorded in terms of its volume, bubble size, speed of formation and time taken for the foam to collapse after aeration has ceased (Table 1).
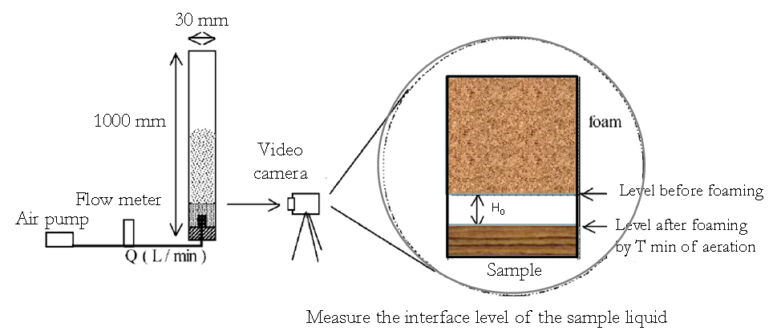
Foam Power (FP) evaluates the foam potential/stability of MBR activated sludge in accordance with the concepts used in food science. FP is defined as 'the consumed sample volume (mL) from foaming by 1 L of aeration' (Nakajima and Mishima, 2005). 100 mL of activated sludge sample is placed in a transparent 7 cm2 cross-section vertical cylinder and aerated for 30 s (T) at an air flow (QAir) of 5 L min-1(Figure 2). The FP is then determined from the difference in the interface levels of the sample liquid and foam before and after aeration (H0):
While somewhat rudimentary, FR measurement is useful for quickly assessing the extent of foaming risk (none for FR = 0; overt/onerous for FR = 6−7). By contrast, FP is scientifically rigorous, and essential for analysis of foaming potential and prediction of foaming risk. Furthermore, FP has been closely correlated with EPS concentration (Di Bella et al, 2011; Di Bella and Torregrossa, 2013), and so can be indirectly associated to the physiology of the activated sludge and with other phenomena dependent on them (such as membrane fouling rate). However, both tests are simple and can be conducted directly in situ with similar simple equipment.
2.2 Quantity test
MBR foam quantity can be directly measured on site or assessed using a series of foamability tests that simulate the aeration conditions in a plant and indicate the sludge propensity to generate foam. Generally, the direct measurements allow evaluation of the main characteristics of the foam formed in the bioreactor: height or thickness, and surface area. They are overall measures of 'Foam volume' and 'Foam surface covered'.
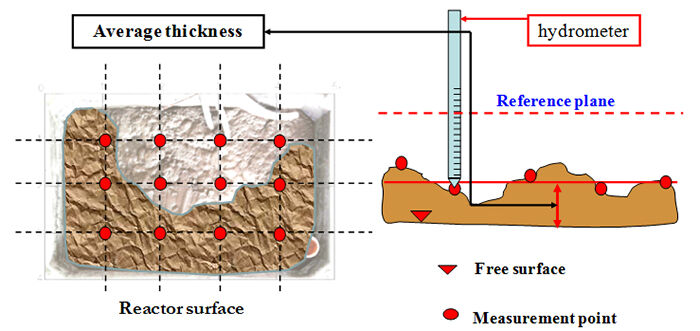
Foam Volume (FV) is the product of the area of the aerobic reactor covered by foam (FSC) and the foam thickness. The area covered can be measured with a perpendicular photographic device coupled with digital image analysis (Figure 3), and a hydrometer for determining the mean foam thickness (the arithmetic mean of different measurements taken at different points on a fixed horizontal grid). While this parameter has been correlated with EPS − Di Bella and Torregrossa (2013) observed a correlation between FV and EPS concentration in the mixed liquor and foam − its repeatability is rather low. The aerobic tank configuration may affect the foam accumulation on the surface, creating inhomogeneity and so reducing repeatability. The repeatability is even lower in terms of the FSC, such that measures of FSC are often used only as a general assessment of the development and severity of the phenomenon.
More useful for foaming assessment in an MBR plant is the Modified Scum Index (MSI) (Di Bella and Torregrossa, 2013). The MSI allows the quantification of the foam fraction from EPS (generally more abundant but less stable foam) compared with that due to the presence of filamentous bacteria (usually lower in mass but more highly stable). Accordingly, MBR foam may be attributable to EPS alone.
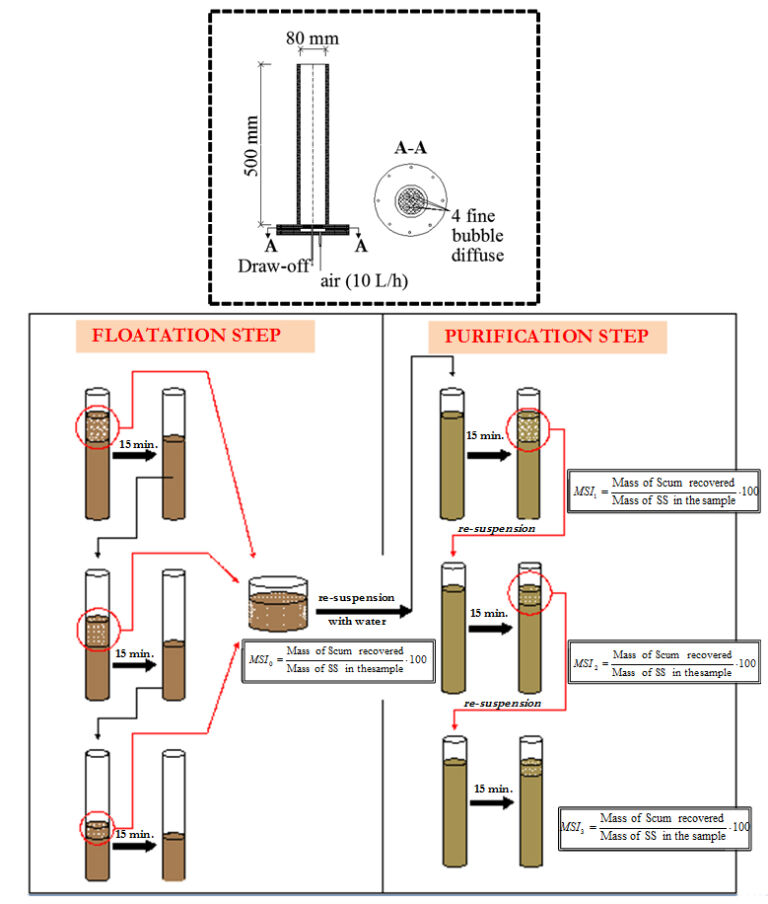
MSI is determined using a 2-litre aliquot of activated sludge, taken from the aeration tank, which is placed in the flotation cell and aerated at an intensity of 10 Lair L-1 h-1 for 15 min to form a thick, stable layer of scum. On ceasing aeration the scum layer is separated from the non-floating sludge and the test repeated several times (depending on the filamentous bacteria content) on the residual unfloated material until all of the foam-forming micro-organisms are transferred into the scum. With each step the extracted scum is stored. This first phase is called 'flotation step'. The portion of scum separated in this phase contains the foam produced by both the EPS contribution and the growing biomass. The dry mass of recovered scum can be determined and the MSI0 calculated as:
Following the flotation step, the floating scum is placed back in the flotation cell and re-suspended with water to a total volume of 2 L. Subsequently, the 'purification step' is performed under controlled aeration conditions for 15 min and the process of re-suspension and dilution (with pure water) repeated, with steps of 15 min, until the amount of foam formed is constant. These portions contain only the foam-forming biomass. The few experiments conducted on experimental plants (and real plants in Sicily) have shown that the step of 're-suspension' varies from 0 to 3 depending on the population of foam-former bacteria. The equation above provides the Scum Index for each purification step in the step-by-step process (MSI1, MSI2, MSI3, etc) to gauge foaming propensity (Table 2) based on determinations using simple equipment (Figure 4).
| Effect of scum flotation step − MSI0 [%] | Effect of scum purification step − MSI1 [%] | Effect of scum purification step − MSI2 [%] | Effect of scum purification step − MSI3 [%] | |
|---|---|---|---|---|
| Low | 0−10 | 0−10 | 0−7.5 | 0−5 |
| Moderate | 10−15 | 10−15 | 7.5−12.5 | 5−10 |
| Serious | 15−25 | 15−20 | 12.5−17.5 | 10−25 |
| Excessive | >25 | >20 | >17.5 | >15 |
In general, it has been demonstrated that the dilution of the separated scum samples could have a negative influence on the original impact of EPS concentration. For this reason, it is believed that the MSI0 represents mainly the effect of foaming due to EPS. Conversely, purifying the foam by dilution and re-suspension isolates the contribution from filamentous bacteria, as demonstrated by correlations against EPS concentration in three different MBRs (Figure 5, Di Bella and Torregrossa, 2013): recorded differences in the types of foam across the three installations were due primarily to those in the mixed liquor EPS concentrations and quantities of filamentous bacteria. In MBR1, the foam-stabilising bacteria were absent, while in MBR2 and MBR3 different amounts of foam-forming and stabilising filamentous bacteria were found. This influenced the MSI test significantly. In general, in the absence of filamentous bacteria, it was possible to run only the flotation step (MSI0): on separating the foam in the flotation phase, the purification phase on the re-suspended sample resulted in no foam due to EPS dilution. Against this, for MBR2 it was possible to apply the complete protocol of the MSI test, starting with flotation (MSI0) and ending with purifying the foam in three separate steps (MSI1, MSI2, MSI3). For MBR3, which had a small quantity of foam-forming bacteria, the MSI test continued until the first step of purification, with measurable values of MSI0 and MSI1.
As already discussed, in the absence of filamentous bacteria, the foam of an MBR plant (i.e. MBR1) is unstable and influenced only by the concentration of EPSs, confirming the results obtained in other studies (Di Bella et al, 2011, Cosenza et al, 2013). Thus, in this context, the measurement of the abundance of filamentous bacteria, by microscopic observation, is essential to validate the Foam Test.

2.3 Microscopic observation
The abundance and dominance of filamentous micro-organisms by microscopic analysis can be estimated using the criteria suggested by Jenkins et al. (2004). This method is based on observing morphological and physiological characteristics of bacteria, including branching, motility, filament shape length and diameter, location, growth of attached epiphytic bacteria, sheath, cell septa, cell shape, floc size, sulphur deposits, and Neisser and Gram staining. The abundance of filamentous micro-organisms (Ab) is evaluated using the subjective 'scoring' of the filaments according to the index proposed by Jenkins et al, assigning a numerical value to the presence of filaments on a scale from 0 to 6 (Jenkins et al, 2004).
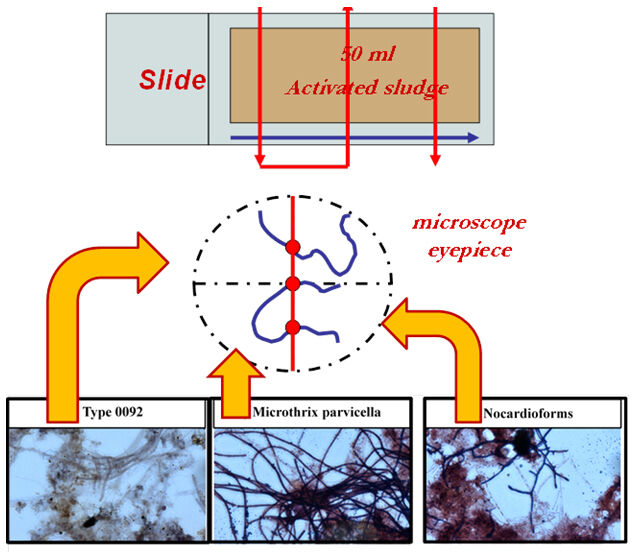
The quantitative estimation of foam-forming micro-organisms can be calculated using a 'fast method'. A 50 mL sample is placed on the slide and the sample stained (Gram and Neisser) to identify the number of Gram and Neisser positive filaments. This is based on the number of intersections of a certain type of positive filament detected along with the total number of such positive filaments per unit area of the microscope slide (Figure 6). The mean number of intersections across five samples (XAVG) is normalised against the total mass of volatile suspended solids (VSS) in the microscopic sample (V in µL) and corrected for the magnification M to produce the Normalized Intersections Number (NIN):
where the 106 factor converts µl to L.
Cursory studies have indicated some key outcomes:
- MBR systems often exhibited foaming with only few filamentous bacteria present, attributed to high EPS concentrations.
- In other cases, despite negligible amounts of well-known foam-forming bacteria (Microthrix parvicella, Nocardioforms, and Nostocoida limicola III), the development of less widely-recognised foaming morphotypes (E. type 0092, E. type 00941, E. type 1851) was observed in the biocenosis of biological foam.
- It has been shown that there is a significant correlation between NIN and scum index calculated from the purification stage (MSI2 or MSI3).
3. Final considerations and future outlook
Foaming in MBR plants has been less extensively studied at full-scale than in CAS plants, with research mainly focused on experimental pilot plants (Di Bella et al, 2011; Cosenza et al, 2013; Di Bella and Torregrossa, 2013). However, there is a persuasive case for combining the simple analytical approaches outlined (ex-situ measurement of foaming propensity and microscopic enumeration of filamentous bacteria) with EPS concentration to provide a protocol for determining foaming propensity of sludge samples taken from full-scale plants. Chemical EPS determination may be considered overly-sophisticated to be used routinely for full-scale plants. However, a simple analytical method based on the well-known 'India ink reverse stain' method originally implemented by Jenkins et al (2004) has recently been proposed (Capodici et al, 2015) for evaluating bound EPS (i.e. EPS associated with the micro-organism cell walls). This may then allow estimation of EPS by optical microscopy.
There is clearly much more to learn about foaming in MBRs. Considering the huge amount of research dedicated to fractionating sludge samples to elucidate membrane fouling propensity, applying an analogous fractionating method to quantify foaming propensity is perhaps long overdue.


