Channel clogging in membrane bioreactors

Simon Judd
Professor of Membrane Technology, Cranfield University, UK and director of
Judd Water & Wastewater Consultants
1. The clogging issue
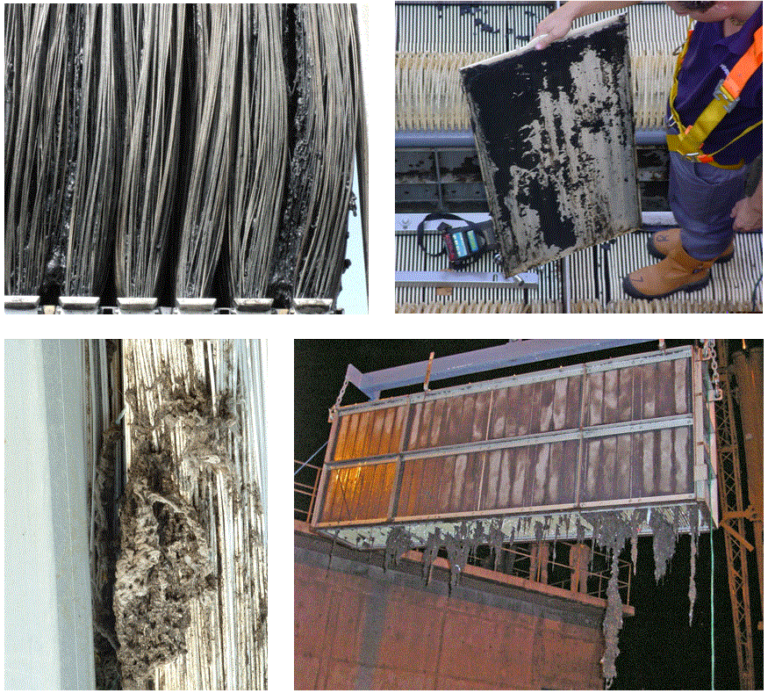
It has been a decade since the phenomenon of clogging was first reported in the academic literature by the Montpellier group (Lebegue et al., 2009). Clogging, as explained previously on this site, can take place either within the channels as a thick deposit which fills the channel ('sludging' or 'localised dewatering'), or in the tank to form long rags/braids which wrap around the membrane tank infrastructure ('ragging' or 'braiding'). In either case the chemical clean is normally largely ineffective, since it is only capable of attacking the foulants on the membrane surface and leaves the clogged material filling the membrane channels largely unaltered.
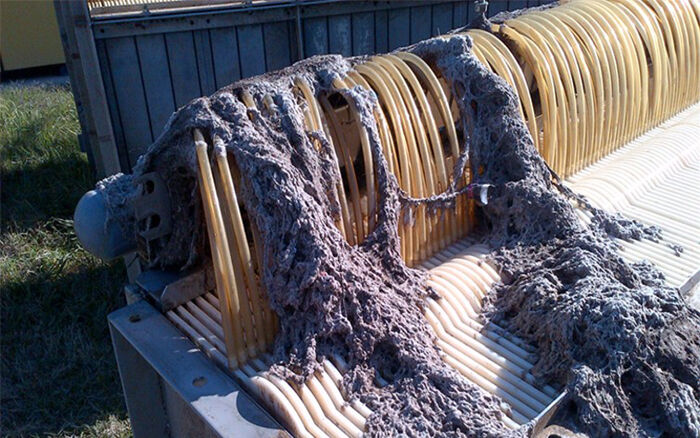
While there have been a few reports from various practitioners of sludging and ragging phenomena (Stone and Livingston, 2008; Mason et al., 2010, Gabarrón et al., 2013), academic research into the causes of sludging in particular has been extremely limited. It has generally been assumed by the academic community that permeability reduction can be attributed largely to fouling of the membrane surface by various soluble or colloidal organic species, mainly deriving from the biomass. Work in this area has been extensive, apparently making up 20–25% of all published MBR studies (Judd, 2018). However, few of the myriad fouling studies acknowledge the possibility of phenomena other than fouling being responsible for membrane permeability reduction.
2. Sludging rate measurement
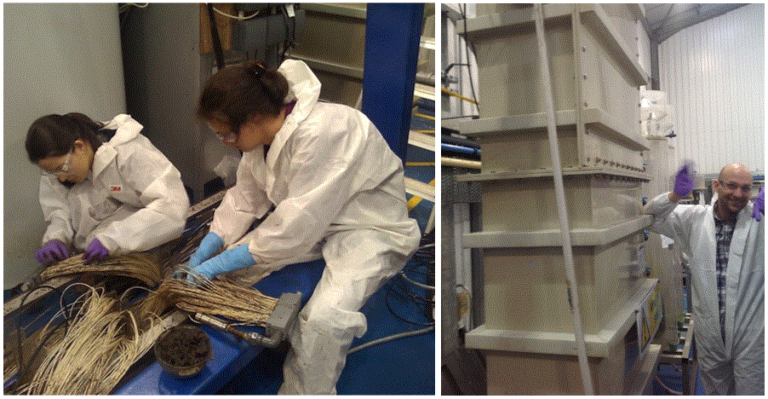
Perhaps the key reason why so few researchers have studied sludging is that it’s not the easiest of things to measure. The group at Cranfield in the UK has reported results from two different gravimetric methods, both applied to HF membranes. For the first of these (Buzatu et al., 2012) the retained sludge solids were removed manually and measured ex-situ. This method is extremely accurate but also (a) disruptive, in that once the solids are removed it’s impossible to continue the same test, and (b) labour intensive – something to which Drs Buzatu and Gabarrón will attest (Fig. 2a). The second method was to simply weigh the clogged membrane (Zsirai et al., 2014). This is less accurate, because the amount of water retained by the membrane when it is removed for weighing varies from one measurement to the next, but is less disruptive and far less labour intensive – making Dr Zsirai rather happier than Drs Buzatu and Gabarrón (Fig. 2b).
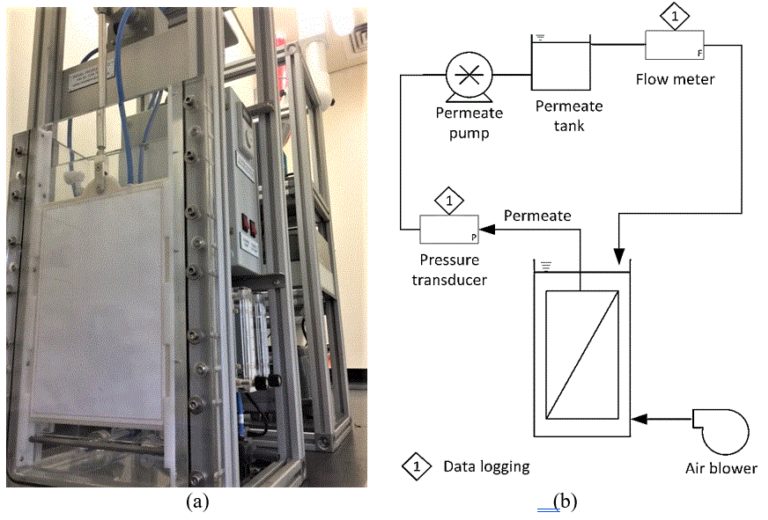
A study by the group at Qatar University published last year (Buzatu et al., 2018) was focused on a flat sheet (FS) membrane. The work was conducted at the bench-scale using a small 'A4'-sized panel, and MBR sludge samples extracted from local full-scale operating plant, one industrial and one municipal. The test apparatus was very simple, comprising a 6 mm-thick membrane channel open on one side to allow both the aeration pattern and the clogged solids to be viewed (Fig. 3). Permeate was extracted through the membrane channel at different flux rates and the trans-membrane pressure logged in the usual way. In this case the build-up of the sludge solids was logged by periodically draining the channel, photographing the channel and digitally analysing the image. Again, this was no more disruptive than the gravimetric method of Zsirai et al. and offered the advantage of indicating the pattern of clogging over a 2D surface.
3. Overview of results
3.1 Sludging impacts on transmembrane pressure and residual permeability
Buzatu et al. (2012) reported two important findings:
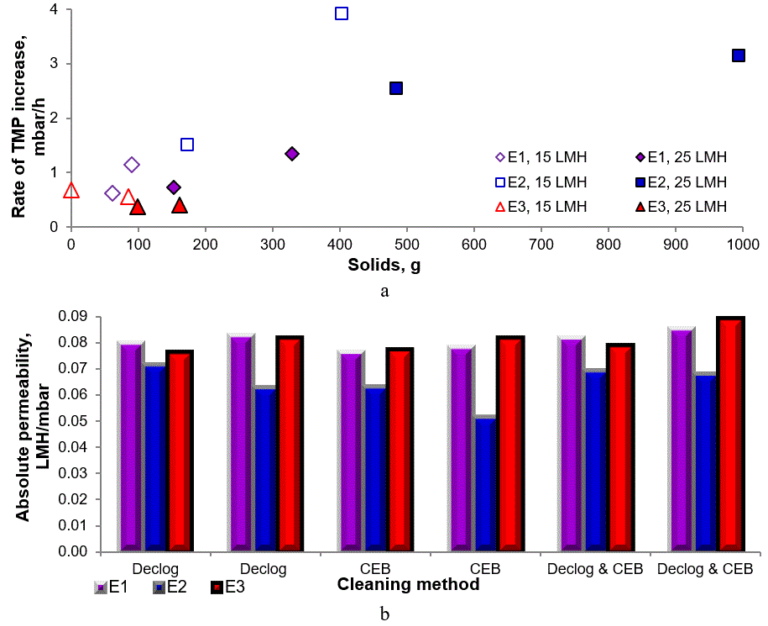
- The rate of increase of the TMP with time (usually referred to as the 'fouling rate') increases with increasing solids accumulation (Fig. 4a), and
- The residual permeability of the membrane once desludged and chemically cleaned decreased with increased clogging (Fig. 4b).
Point b is demonstrated by the consistently lower permeability of central membrane element 2 (E2) compared with elements E1 and E3 following cleaning. E2 was the central element which, as indicated in Fig. 4a, accumulated more sludge solids more rapidly than the two outer elements E1 and E2.
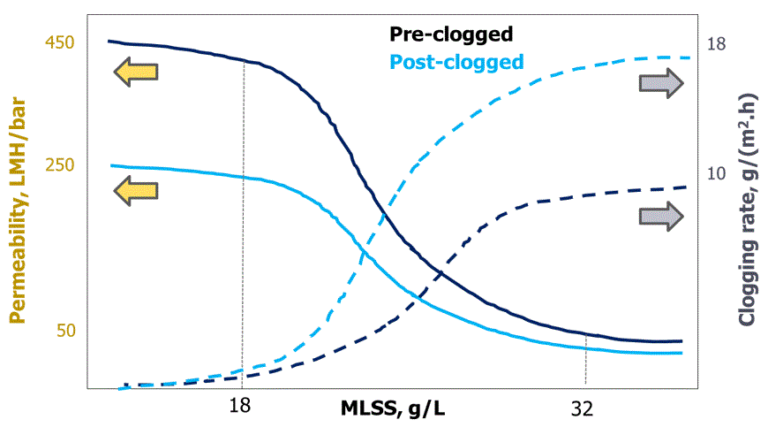
So it appears that sludging cannot be distinguished from fouling based on the TMP transient, since in both cases the expected TMP increase arises. The key difference is that sludging is not substantially removed by the chemically-enhanced backwash (CEB). It also seems that once a membrane is heavily sludged its original permeability is not recovered by mechanical and chemical cleaning – at least in the case of the PVDF HF membranes used in the study. This latter point was also observed in subsequent work by Zsirai et al. (2014) based on similar membranes but challenged with high mixed liquor suspended solids (MLSS) concentrations (6-32 g/L MLSS) to exacerbate sludging. The authors reported a precipitous decline in permeability at around 18 g/L MLSS with an associated increase in clogging rate (Fig. 5). As with Buzatu et al. (2012), the residual permeability of the chemically-cleaned membrane post-clogging was consistently less than that of the original permeability. The same effect was not observed with fouling alone, where the initial permeability was recovered by the CEB.
3.2 Sludging correlations with MLSS properties
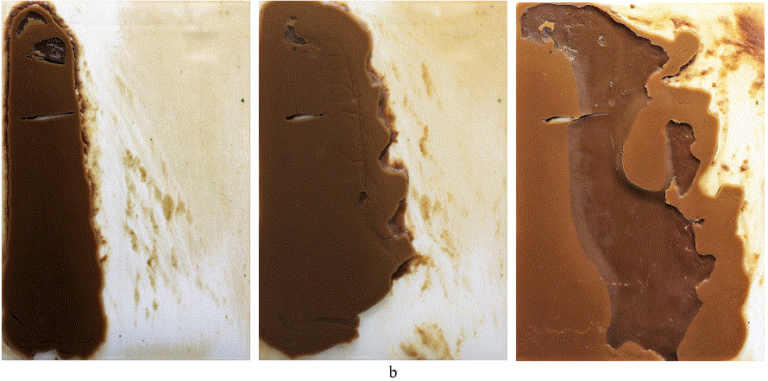
The more recent work conducted at Qatar University, based on a flat sheet membrane (Fig. 3a), aimed to identify patterns in clogging behaviour from accelerated testing. The authors observed clear differences in clogging characteristics between a more challenging, less-filterable industrial sample compared with a municipal sample (Buzatu et al., 2018). Whereas the municipal sludge formed a cake on the surface but did not fill the channel (Fig. 6a), complete sludging was observed with the industrial sample (Fig. 6b).
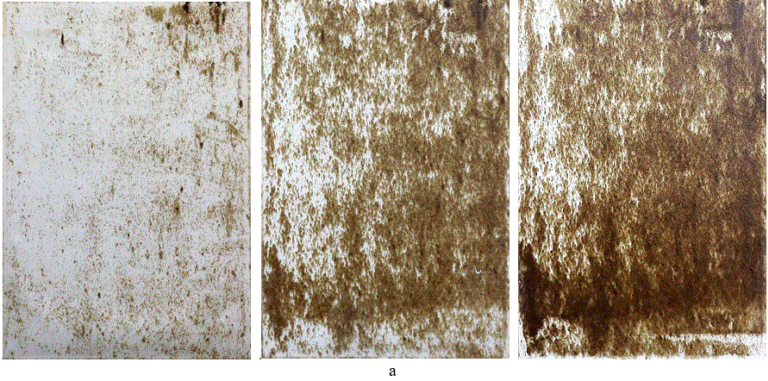
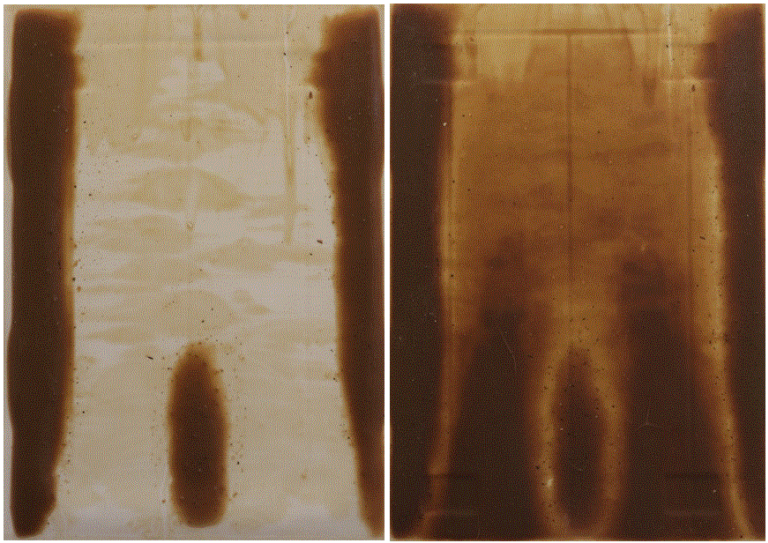
No correlation was evident between fouling and sludging for either sludge sample, in that sludging was not associated with the dissolved COD concentration whereas fouling increased with soluble COD as expected. The only parameter which appeared to be directly associated with sludging was the MLSS concentration, which then also affected the sludge rheology. Interesting, it was at the excessive MLSS concentrations above 18 g/L that sludging was most pronounced, the retained solids collecting at the membrane panel edges (Fig. 7) due to the constriction of the air bubble stream associated with the highly viscous fluid (see the video below, showing the air bubble stream and clogging in a flat sheet MBR). Air bubble stream constriction in viscous fluids is well known, having been originally reported by Tomiyama et al. in 2002.
Clogging versus fouling in immersed membrane bioreactors
4. Summing up
The outcomes from the sludging studies so far have provided an indication of the impacts of this phenomenon, with some tentative steps towards identifying the causes. It seems clear that it is the physical characteristics of the sludge, and probably its rheological behaviour, which leads to sludging. This being the case, the most effective approach to practical sludging control is likely to be in maintaining even MLSS concentrations throughout the membrane tank through effective air scouring and good system hydraulics to minimise concentration polarisation.
However, there can be no doubt that there is considerably more to learn regarding the root causes of sludging, and that fouling phenomena (which are largely related to system biochemistry) are unlikely to be relevant. Unlike fouling, sludging is not ubiquitous. But, also unlike fouling, severe sludging is not rectified by chemical cleaning. Clearly, there needs to be a more concerted effort to understand sludging if many practitioners are not to be left scratching their heads.


