Effects of ferric and ferrous iron addition on membrane bioreactor effluent quality

Yuan Wang1,2, Keng Han Tng2, Hao Wu1, Zhenghua Zhang1, Xuefei Liu2, Greg Leslie2 and T. David Waite1
1 Water Research Centre, University of New South Wales, Sydney 2052, Australia
2 UNESCO Centre for Membrane Science & Technology, University of New South Wales, Sydney 2052, Australia
1. P removal issue
Municipal wastewater usually contains between 4 and 12 mg/L total phosphorus (TP) concentrations in the range 4−12 mg/L. A conventional activated sludge process (CAS) can take this down to 2−4 mg/L, or 0.5−1 mg/L if an enhanced biological phosphorus removal (BPR) process is used (Fig. 1). To achieve the sort of levels required to suppress eutrophication, however, demands P levels of 0.01−0.3 mg/L − normally achieved chemically by coagulant dosing downstream of the CAS followed by tertiary media filtration.
In the case of MBR technology, such chemical P removal is typically through dosing the mixed liquor. The logistics and control of chemical addition along with the mechanics and efficiency of chemical P removal are thus more complex in the MBR process compared to CAS. Coagulant dosing has been reported to suppress membrane fouling if applied at low-to-moderate concentrations (Fe:P molar ratios < 1). However, much higher concentrations (at Fe:P molar ratio of 1.5−4.0) are needed when almost complete P removal is the aim. This would then be expected to influence the nature and extent of membrane fouling, even though most of the iron coagulant dosed appears to end up in the sludge and would be expected to be readily removed from the membrane surface by air scouring and backflushing. On the other hand, high levels of iron may promote the formation of a gelatinous layer on the membrane, or generate colloids that may possibly cause membrane pore plugging.
A study of the impacts of ferric chloride and ferrous sulphate coagulant dosing on P removal has been conducted by researchers at the University of New South Wales on both MBR membrane fouling and the extent of P removal attained. Of particular interest was the impact of i) use of either Fe(II) or Fe(III) salts, ii) dosing location and amount and iii) pH control on both phosphorus removal and membrane fouling. The work was conducted initially at the bench scale, with molar dose ratios of Fe to P at either 2 or 4 and, pH levels of 4−7.5 and the coagulant dosed either in the anoxic or aerobic section of the MBR. The work was subsequently extended to the pilot scale.
2. Bench scale study
2.1 Experimental set-up
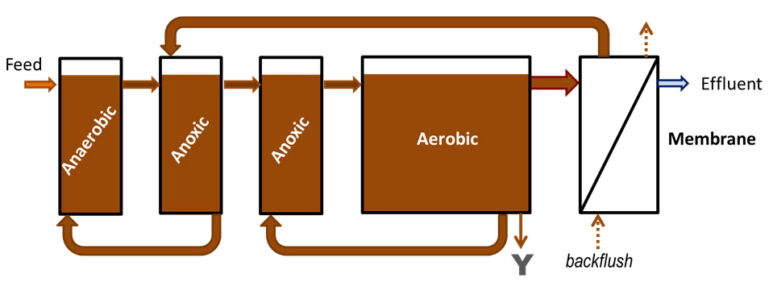
Three bench-scale MBRs with a working volume of 30 L each (6 L anoxic zone, 18 L aerobic zone and 6 L membrane compartment, Table 1) were operated at 22 (plus or minus 1) oC for five months prior to iron coagulant dosing of two of the reactors, the other acting as a control. Each MBR contained various compartments separated by baffles (Fig.1). The membrane modules comprised reinforced 0.3 μm pore size PVDF hollow fibre membranes of 0.2 m2 total surface area (Beijing Origin Water, China) immersed into the membrane compartment above the coarse bubble aerators. Effluent was withdrawn intermittently (9 min on: 1 min off) at a net flux of 16.7 L/m2.h (LMH), corresponding to a hydraulic retention time (HRT) of 10 hrs. The maximum transmembrane pressure (TMP) was 40 kPa, at which point external rinsing with water was applied. Synthetic wastewater (BOD5=200 mg/L; COD=400 mg/L; TOC=180−220 mg/L; TN=60 mg/L; TP=10 mg/L) was used as the feedwater (Table 2).
| Reactor volume | 30 L |
| Membrane nominal pore size | 0.1−0.3 μm |
| Total membrane area | 0.2 m2 |
| Filtration/relaxation ratio | 9 min : 1 min |
| Filtration flux | 16.7 LMH |
| Hydraulic retention time | 10 h |
| Sludge retention time | 30 days |
| Recirculation ratio | 300% |
| MLSS | 8−9 g/L |
| MLVSS/MLSS | 0.8−0.85 |
| DO | 1.5−2.5 mg/L |
| pH | 6−7 |
| Temperature | 22 °C |
| F:M | 0.1 kg−BOD/ kg−MLSS/day |
| COD:N:P | 100:15:2 |
| Aeration for bioreactor | 0.005 Nm3/min |
| Aeration for membrane scouring | 0.01 Nm3/min |
| Compound | Concentration (mg/L) | Water Quality Index | Concentration (mg/L) |
|---|---|---|---|
| Glucose | 150 | BOD5 | 200 |
| Sodium acetate | 300 | COD | 400 |
| Peptone | 15 | TOC | 180−220 |
| Meat extract | 15 | Ammonia-N | 20−30 |
| NH4CL | 140 | Total Nitrogen (TN) | 40−60 |
| KH2PO4 | 35 | Total Phosphorus (TP) | 10 |
| MgSO4.7H2O | 30 | ||
| FeSO4.7H2O | 5 |
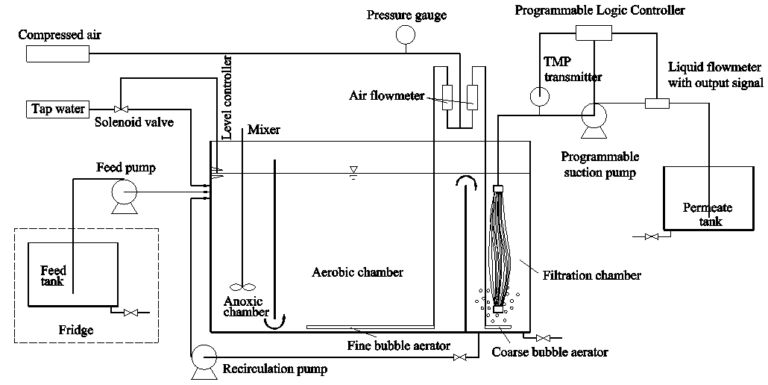
The effectiveness of the addition (by continuous pumping) of ferric and ferrous salt solutions to the anoxic or aerobic chamber in the bench-scale MBRs (in the absence and presence of pH control) on phosphorus removal and membrane fouling was assessed from March 2011 to September 2012 (Table 3), each dosing regime lasting for more than 3 months (3 SRTs). On completion of the dosing regime, the reactors were operated in the absence of any coagulant for a further 3 months to discharge any residual coagulant before restarting the test using a different regime.
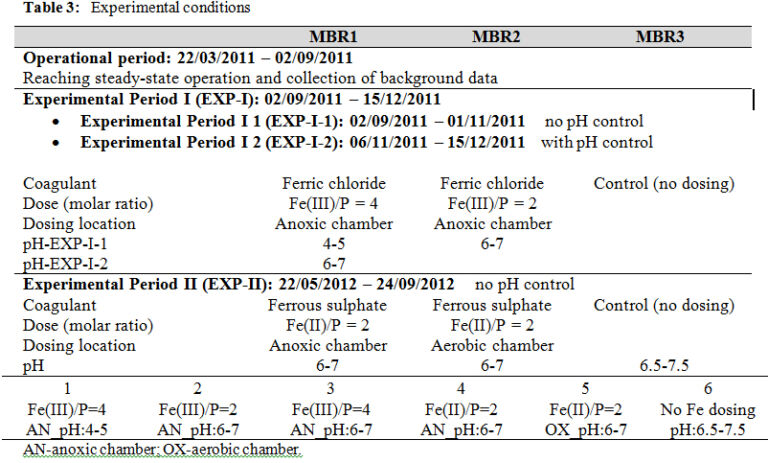
During the addition of ferric iron, dosing was continued without any pH control for two months and with pH control for a little over one month for MBR1 (to which more ferric iron was added). The pH of the mixed liquor was continuously monitored and recorded at set time intervals using TPS pH meters (WP-81 and WP-91, TPS, Australia). During the experiments without pH control, sodium bicarbonate solution was occasionally added to the mixed liquor of MBR1 when the pH dropped to below 4 to avoid inhibition. The pH of other test conditions (at lower coagulant concentrations) was mostly maintained above 6 over the same period by the intrinsic buffering of the system. An appropriate concentration of sodium hydroxide solution was continuously pumped to MBR1 during the pH control period to maintain the pH of the mixed liquor between 6 and 7.
2.2 Results
2.2.1 P removal
The concentrations of total organic carbon (TOC), nitrogen (TN) and phosphorus (TP) in the MBR effluent with Fe(III) and Fe(II) dosing are shown in Table 4. Results suggested addition of iron salts at a Fe/P molar ratio of 2 was necessary to achieve a sufficient and consistent level of P removal. Increasing the ratio further (up to 4:1 Fe:P mol/mol) did not further increase the P removal efficiency for ferric salts, although overall improved P removal was noted for ferrous salts compared with ferric salts. Coagulant addition to the aerobic chamber was found to be most effective with 80% < 0.05 mg−P/L, 97% < 0.15 mg−P/L: all 59 samples revealed P levels below 0.30 mg−P/L. Iron dosing also increased TOC removal slightly for both Fe(III) and Fe(II) dosing without inhibiting nitrification. Effluent TN concentrations were consistently between 5 and 8 mg N/L, other than at the highest coagulant dose which reduced the pH to below 5 due to hydrolysis of the ferric salt causing inhibition: nitification was recovered on re-adjusting the pH.

2.3 Fouling
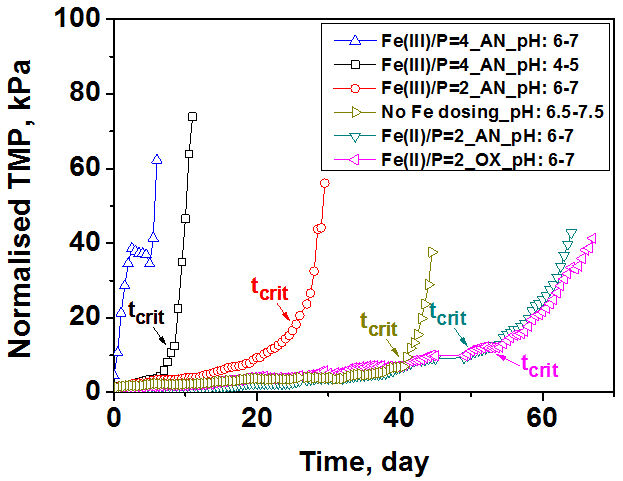
Fouling behaviour in submerged membrane constant flux systems can be assessed by establishing a time (tcrit) after which fouling becomes much more severe based on analysis of the dTMP/dt profiles. The transition from a low to high fouling regime typically occurs over a short time span with a 10-fold higher value for dTMP/dt typically observed after tcrit compared to dTMP/dt before this critical time. The TMP profiles of MBRs for a range of Fe(II) and Fe(III) dosing conditions (Fig. 2) revealed a Fe(II)/P molar ratio of 2 to give the best performance, with a significant delay in the onset of severe fouling: the tcrit of MBRs with Fe(II) dosing (Fe(II)/P molar ratio of 2) significantly increased to 1200−1260 hrs. Fe(III) dosing gave the worst performance with rapid onset of severe fouling particularly at high levels of iron dosing (Fe(III)/P molar ratio of 4): at Fe(III)/P molar ratios of 2 and 4 with pH of 6−7, the tcrit decreased to 672 and 204 hrs, respectively.
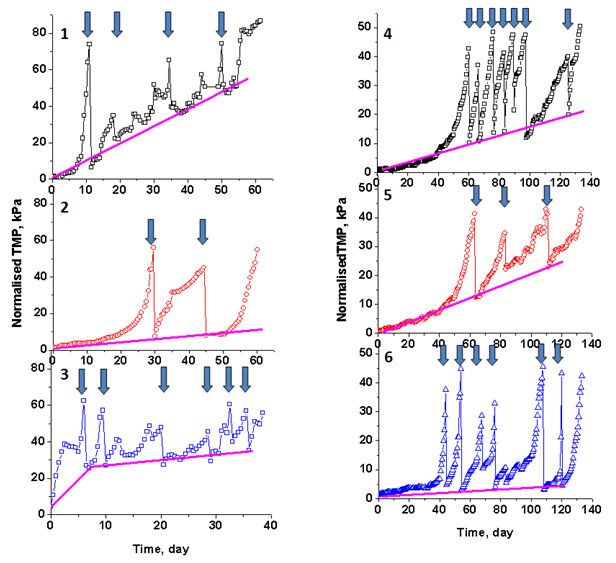
The TMP profiles of the MBRs during the complete operating period for all conditions investigated (Fig. 3) reveals addition of both Fe(III) and Fe(II) to induce the development of irreversible fouling over long-term operation. This is manifested as an increased slope of the plots (dTMP/dt) and the frequency of washing needed to maintain a reasonable TMP. Much more severe fouling was evident at an Fe(III)/P molar ratio of 4 compared to that at a Fe(III)/P molar ratio of 2 (panes 1 and 2 in Fig. 3). Adjustment of the pH to 6−7, rather than the 4−5 resulting from high Fe(III) dosing (pane 3, Fig. 3), resulted in more severe of fouling. Dosing of Fe(II) to the anoxic zone over the same time period (e.g., the first 50 days of dosing) resulted in less fouling than was the case with Fe(III) dosing, though frequent cleaning was required after the initial onset of severe fouling (as evident from Fig. 3). As can be seen by comparing the results in panes 4 and 5 of Fig. 3, dosing of Fe(II) into the aerobic chamber seemed preferable to dosing into the anoxic chamber without frequent rinsing required after the initial onset of severe fouling.
3. Pilot-scale study
3.1 Pilot plant
A pilot-scale membrane bioreactor (3.7 m3/day capacity, 1.25 m3 working volume), based on alternate point ferrous sulphate (FeII) dosing, was conducted over a fourteen−month period (April 2012 to July 2013). The target compliance for the discharged effluent was <0.15 mg−P/L at the 50th percentile and <0.30 mg−P/L at the 90th percentile. The plant was located at Sydney Water’s Bondi Wastewater Treatment Plant (WWTP) in the eastern suburbs of Sydney, with primary treatment comprising coarse screen, grit chamber and primary sedimentation tanks. The primary treated effluent from Bondi WWTP was used as the feedwater to the pilot-scale MBR.
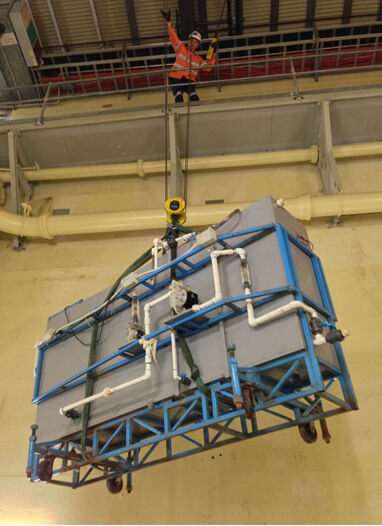
The pilot MBR (Fig. 5) was designed to mimic the configuration of Sydney Water’s full-scale MBR at Brooklyn, which consists of a primary anoxic zone for pre-denitrification, aeration zone, secondary anoxic zone and membrane filtration chamber. The MBR was fitted with four reinforced PVDF membrane modules (Fig. 6), providing a total surface area of 10.4 m2, having a nominal pore size of 0.3 µm in a vertical hollow fibre configuration with internal and external diameter of 1.3 mm and 2.2 mm respectively (Beijing Origin Water, China). The reactor was operated with an HRT of 10 hours and an SRT of 30 days. The membrane modules were operated in intermittent mode with 7 minutes of filtration followed by 1 minute relaxation at an instantaneous flux of 15.6 L/m2.h (LMH).
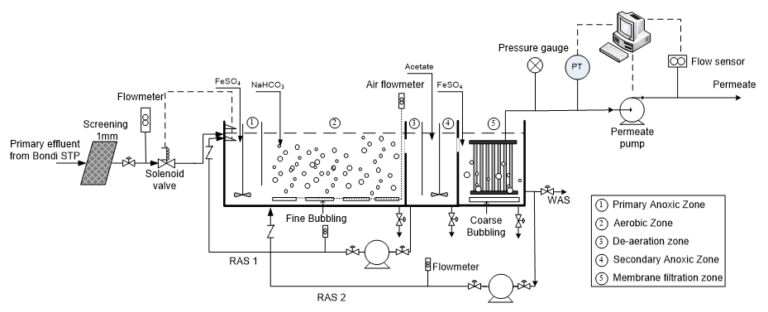
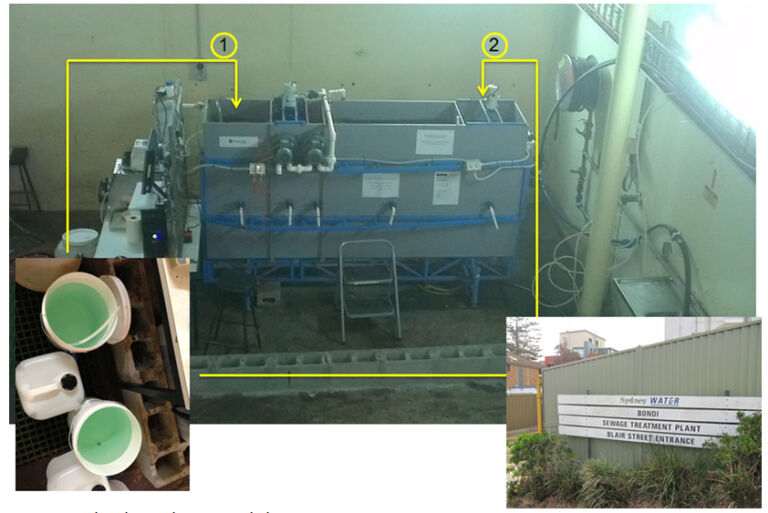
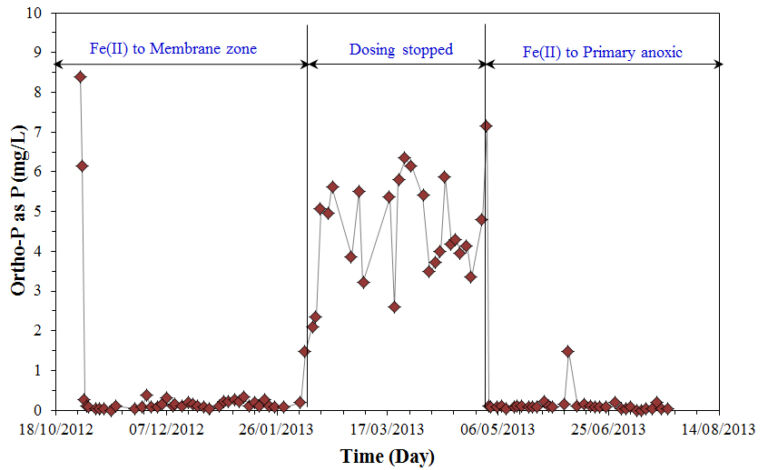
A target molar ratio of Fe2+ : P of 2:1 was used for the study to evaluate the efficiency of ferrous salts. 0.12 M ferrous iron solutions were pumped to the pilot reactor at a constant flow rate, yielding a molar ratio of Fe(II) to orthophosphate of 2.01 to 4.10 during the whole experimental period (due to the fluctuations of influent phosphorus concentration). Two dosing locations were tested: i) to the membrane filtration zone from 30 Oct 2012 to 6 Feb 2013 and ii) to the primary anoxic zone from 1 May 2013 to 31 July 2013. Specifications of the pilot trials are given in Table 3.
Apart from the four membrane modules (used for normal operation), a virgin experimental membrane module (total surface area = 0.1 m2) was placed in the membrane filtration tank for the characterisation of membrane fouling potential of different experimental regimes (i.e. no dosing and dosing to different locations). The experimental module operated in intermittent mode with 9 minutes of filtration followed by 1 minute relaxation at an instantaneous flux of 16.7 L/m2.h (LMH), as used for the bench-scale trial.
Ferrous sulphate was added at a molar ratio (Fe(II):PO4) of 2.99 in the filtration chamber for 85 days and 2.60 in the primary anoxic zone for 111 days.
3.2 Results
Addition of ferrous salts to the anoxic zone at a molar ratio of 2 achieved a final effluent phosphorus concentration (mg−P/L ) of < 0.05 (29%), < 0.15 (77%) and < 0.30 (95%), while dosing onto the filtration zone achieved < 0.05 (18%), < 0.15 (63%) and < 0.30 (95%) (Fig. 7). The addition of ferrous salts improved the removal efficiency of dissolved organic carbon and did not exhibit any inhibition on poly-P and organic P removal. Adverse impact on ammonia removal could be eliminated by maintaining the pH of the mixed liquor above 6.
Analysis of the concentration of iron(II) in the supernatant indicated that phosphorus was mainly removed via adsorption to amorphous iron oxyhydroxide particles in both dosing scenarios. However, analysis of residence time distribution data of the reactor indicated that severe short-circuiting from the dosing point to the membrane outlet could occur when the ferrous salts were added to the membrane zone. Against this, the reactor behaved close to a completely mixed reactor when dosing to the primary anoxic zone, resulting in improved phosphorus removal. The addition of ferrous salt was also found to delay the onset of a severe increase in the TMP as a result of the removal of macro-molecules (Fig. 8).
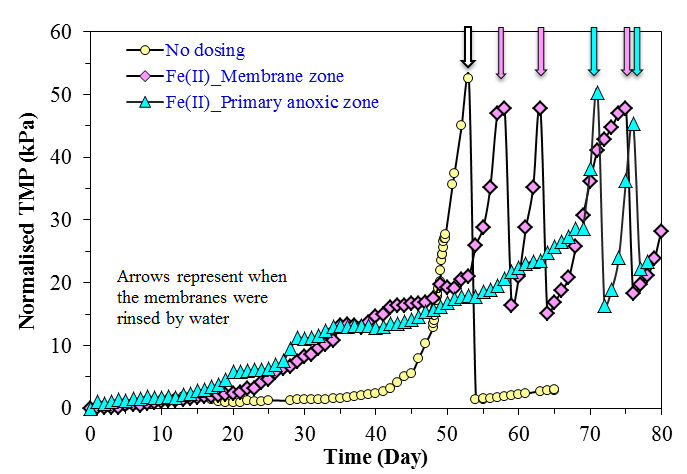
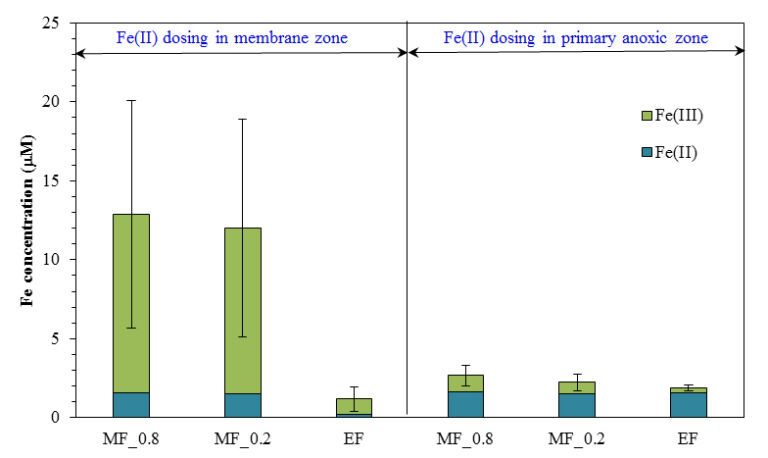
However, detailed analysis of the form and concentration of iron species in the supernatant and permeate indicated the presence of fine ferric oxyhydroxide particles when Fe(II) was added to the membrane zone rather than the primary anoxic zone. These particles contributed to a higher fouling rate, and could cause more severe irreversible fouling in long-term operation.
4. Conclusions
Both the form of the iron coagulant (ferrous, Fe(II), vs. ferric, Fe(III)) and the point at which it is introduced to the MBR, the anoxic, aerobic or membrane compartment, appears to significantly influence performance (Fig. 9). Analysis of iron species in the MBR supernatant of the membrane filtration chamber indicated that the concentration of colloidal and dissolved iron species was four times higher when Fe(II) was added to the membrane zone compared to the addition to the primary anoxic zone. These fine particles were retained during the filtration process resulting in a significantly faster fouling rate. Although iron salts could delay the onset of the sudden rise in TMP, the presence of fine iron particles could lead to more severe irreversible fouling in long-term operation.
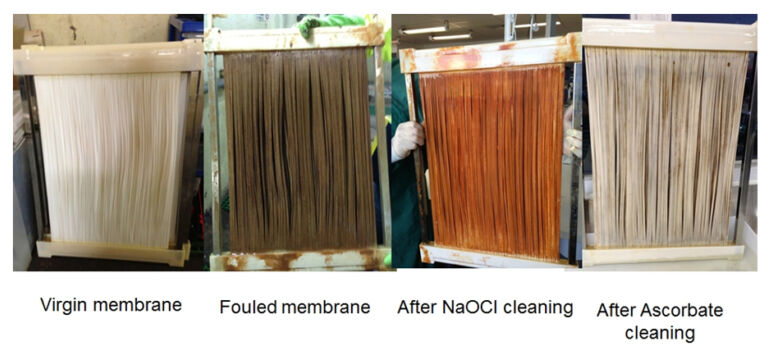
Results from bench-scale studies using synthetic wastewater suggested ferrous salts could effectively remove phosphorus, and ferrous salts thus selected for pilot-scale studies based on real wastewater. Results from pilot-scale studies confirmed that the addition of ferrous salts at an Fe(II):PO4 molar ratio of 2 and above could effectively reduce the phosphorus concentration below typical discharge limit requirements. Both bench- and pilot-scale studies showed that the rate of fouling before the rapid TMP rise was reduced by ferrous coagulant dosing, mainly due to the removal of macromolecular organics from the MBR supernatant. However, fouling by iron oxides remains an issue, and subsequent work demonstrated the effectiveness of reductive cleaning reagents such as ascorbic acid for chemical cleaning (Fig. 10).


