Survey of Japanese municipal MBRs

H. Itokawa, K. Tsuji, K. Yamashita and T. Hashimoto
H. Itokawa, K. Tsuji, K. Yamashita and T. Hashimoto of the Wastewater Treatment R&D Division, Japan Sewage Works Agency (JS) review data from 19 municipal plants operating in Japan − 17 new build and two retrofit
1. Introduction
In Japan, there are over 3,000 MBRs which have been in operation since the 1980s for small-scale on-site industrial/household wastewater treatment. However, municipal wastewater applications began only in the mid 00’s, leading to 19 operational full-scale plants by April 2013 (Table 1).
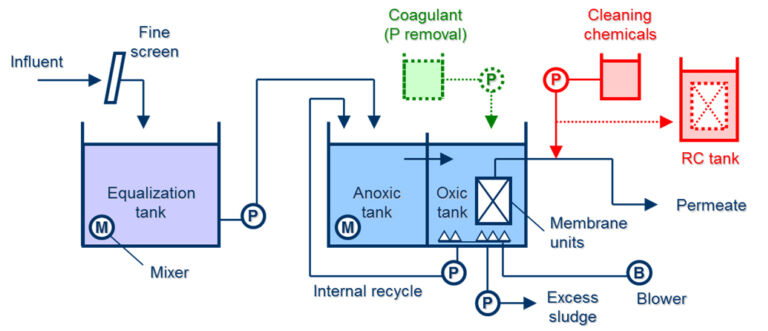
Most of these are new builds designed according to the Japan Sewage Works Agency MBR Design Recommendations (or ‘JS Recommendations’), prepared by JS for small-scale municipal immersed systems (iMBRs) and based on the MLE (Modified Ludzack−Ettinger) process for N removal (Fig. 1). The increased number of references permitted a review of process performance, based on a comprehensive capture of data between 2009 and 2011. A follow-up survey has subsequently been conducted on these installations, incorporating outputs from a government-supported demonstration programme where one wastewater treatment lane in a classical ASP was retrofitted with an MBR with a view to appraising energy demand.
| No. | Commissioned | Capacitya [m3/d] | Membraneb |
|---|---|---|---|
a Design maximum daily flow, not including allocation for future expansion. | |||
| 1 | March 2005 | 4,200 | FS-01 |
| 2 | April 2005 | 240 | FS-01 |
| 3 | December 2005 | 800 | FS-01 |
| 4 | March 2006 | 600 | HF-02 |
| 5 | September 2006 | 1,000 | FS-01 |
| 6 | March 2007 | 125 | FS-01 |
| 7 | April 2007 | 230 | HF-01 |
| 8 | March 2008 | 1,375 | HF-03 |
| 9 | March 2008 | 2,140 | FS-02 |
| 10 | March 2009 | 2,150 | FS-01 |
| 11c | January 2010 | 5,000 | FS-01 |
| 12 | March 2010 | 300 | HF-03 |
| 13 | March 2010 | 6,060 | FS-01 |
| 14 | February 2011 | 150 | HF-02 |
| 15d | March 2011 | 60,000e | FS-01 |
| 16 | March 2011 | 450 | HF-01 |
| 17 | April 2011 | 620 | HF-03 |
| 18 | March 2012 | 2,500 | HF-01 |
| 19 | April 2012 | 500 | HF-02 |
The plants comprise 17 new builds and 2 retrofits (Nos 11 and 15 in Table 1, whereby one train has been fitted with FS membranes for research purposes or for temporary use during construction) with capacities ranging from 125 to 60,000 m3/d, all fed with domestic wastewater. All plants are iMBRs fitted with either flat sheet (FS, ten plants) or hollow fibre (HF, nine plants) membranes from five different membrane technology suppliers.
Data were collected from the 17 new build plants either using a questionnaire or by interview with the plant operators, as well as from available design documentation. 9 small-scale plants (Nos 1−9) were selected for further analysis, these having been operated for more than a year prior to the survey.
2. Results and discussion
2.1 System design
15 out of 17 new build plants were of a standard MLE design (Fig. 1) with 3 hrs of design hydraulic retention time (HRT) for both the anoxic and aerobic tank and recirculation ratios of, typically, 2Q (i.e. twice the maximum daily average feed flow). According to the JS recommendations, anoxic treatment is required to conserve alkalinity regardless of the requirement for N removal and is common practice in Japanese low-loaded, long SRT (solids retention time) activated sludge processes (ASPs). Chemical precipitation of phosphorus has been incorporated at those plants requiring P removal. All plants have fine screening (1 mm for FS and 0.5 mm for HF, both slit screen) and flow equalization as pretreatment, as required by JS Recommendations, providing 4−5 hrs of buffering against diurnal fluctuations in flow.
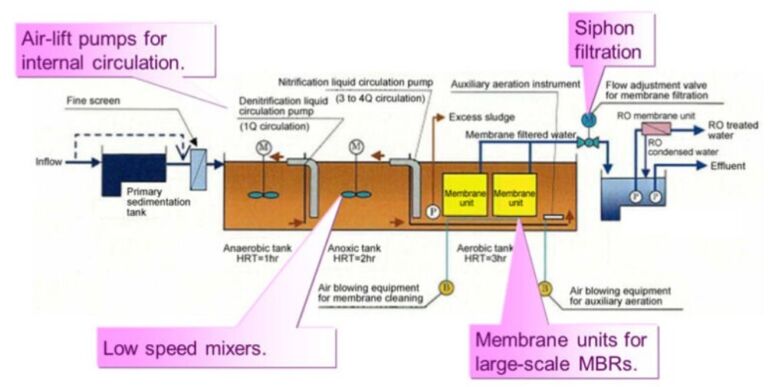
In the case of Plant no. 11, a demonstration plant, a lane of an existing conventional activated sludge (CAS) plant was retrofitted with an MBR of 5,000 m3/d capacity. This lane adopted the UCT configuration (i.e. encompassing an anaerobic pretreatment step) to achieve N & P removal. The programme was focused on reducing energy demand by incorporating: (i) larger membrane units, (ii) siphon filtration, (iii) mixed liquor circulation with air-lift pumps, and (iv) low-energy mixers.
2.2 Biological treatment
Operating conditions for the plants 1−9 (Table 2) indicate low feed flows and correspondingly high HRTs due to under-loading, since all these plants were newly constructed. Only in three cases was the flow greater than 50% of the plant capacity, such that the HRT ranged from 10 to >40 hrs. The bioreactor solids concentration was quite plant-specific, with operators tending to operate at higher mixed liquor suspended solids (MLSS) concentration than the design value (typically 10 g/L in the aerobic tank). P removal by precipitation using polyaluminium chloride dosing of the aerobic tank was applied at two plants.
| No. | Inflow/capacity ratio [%] | Min.temp.[ºC] | HRT [hr] | MLSS [g/L] | Recirculation ratio [%] | P-precipitation* | Netflux [m/d] | Membrane operation |
|---|---|---|---|---|---|---|---|---|
*Using PACl (polyaluminium chloride) | ||||||||
| Design values: | − | 6 | 10 | 2 | − | 0.37−0.74 | − | |
| 1 | 75/60 | 14.4 | 12 | 9.2 | 2.3 | Yes | 0.49/0.39 | Cont. |
| 2 | 13 | 8.5 | 47 | 13.5 | 1.7 | No | 0.07 | Cont. |
| 3 | 49 | 10.3 | 14 | 12.3 | 1.9 | No | 0.32 | Int. |
| 4 | 55 | 13.2 | 10 | 10.8 | 0 | Yes | 0.33 | n.a. |
| 5 | 26 | 11.6 | 24 | 13.6 | 3.8 | No | 0.17 | Int. |
| 6 | 34 | 9.9 | 45 | 17.3 | n.a. | No | 0.24 | Int. |
| 7 | 50 | 11.5 | 15 | 11.3 | 0.2 | No | 0.18 | Int. |
| 8 | 12 | 9.7 | 33 | 9.5 | 5.0 | No | 0.05 | Int. |
| 9 | 12 | 15.1 | 169 | 8.4 | 7.8 | No | 0.09 | Int. |
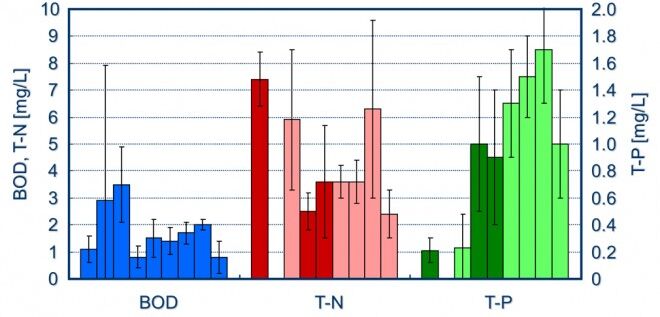
With regards to treated water quality the annual average BOD did not exceed 3.5 mg/L across the nine plants (Fig. 2). The corresponding figure for TN was below 7.4 mg/L, and predominantly below 6 mg/L, since the MLE configuration was employed at all sites. Full nitrification (ammonia levels below 1 mg/L) was achieved in all cases other than for plant No. 3. Surprisingly, six plants experienced occasional suspended solids detection in the effluent, most likely due to permeate line contamination rather than membrane integrity failure.
Of those plants surveyed the enhanced biological phosphorus removal (EBPR) demonstration MBR (No. 11) experienced unstable P removal following start-up. This was addressed by blending raw and primary effluent to provide the process feedwater, along with the temporary addition of PAC (particularly when wet weather conditions prevailed) to comply with the effluent T−P target concentration of 0.66 mg/L. A temporary rise in effluent T−P was also recorded after cleaning in place (CIP), demanding supplementary PAC addition at these junctures. A possible cause for this may have been P release during the CIP, during which the mixed liquor was not aerated.
2.3 Membrane operation
The low flows encountered at the plants meant that the net design flux values of 0.37−0.74 m/d were rarely achieved, the recorded daily average net flux in the range of 0.05 to 0.49 m/d (Table 2) depending on the inflow/capacity ratio. For extreme diurnal fluctuations the membranes were often operated intermittently, pre-aerating to avoid possible problems associated with filtering low-DO sludge. Membrane cleaning was conducted according to supplier specifications (Table 3), with weekly maintenance cleans applied only at one HF (GE) plant. Recovery cleaning frequency ranged from once to five times annually using sodium hypochlorite with supplemental acid cleaning at four plants. More frequent (almost monthly) cleaning was necessary only at Plant 11 due to a combination of higher flux operation (including high peak fluxes), and decreased feedwater temperature during storm events.
| No. | Membrane | Operating duration | Methods of cleaning*1 | Chemicals | Frequency |
|---|---|---|---|---|---|
1CIP: cleaning in place, CES: cleaning ex-situ. 2Dependent on lane. | |||||
| 1 | FS | 5 yr | CIP | NaOCl + oxalic acid | 3/yr |
| 2 | FS | 5 yr | CIP | NaOCl | 2/yr |
| 3 | FS | 5 yr | CIP | NaOCl | 4 or 8/yr*2 |
| 4 | HF | 4 yr | CIP (MC) | NaOCl + oxalic acid | 1/week |
| CES | NaOCl | 1/yr | |||
| 5 | FS | 4 yr | CIP | NaOCl | 1/yr |
| 6 | FS | 3 yr | CIP | NaOCl | 2/yr |
| 7 | HF | 3 yr | CIP | NaOCl | 3/yr |
| CES | Citric acid | 1/yr | |||
| 8 | HF | 2 yr | CIP | NaOCl | 5/yr |
| CIP | Oxalic acid | 1/yr | |||
2.4 Other plant operational issues
The survey revealed a number of sporadic operational challenges, with appropriate measures taken to address them. Only one plant was subject to clogging of the fine screen, due to its use for screening the reject water from sludge dewatering, which was mitigated by altering the dewatering conditions. Some plants experienced occasional loss of nitrification at elevated sludge concentrations or reduced aeration. Air accumulation in permeate pipes was also observed in some plants, requiring installation of an air release mechanism. Coliforms detected in the permeate at a few plants was attributed to ingress, such as from loose pipe connections or, in the worst case, damaged membranes.
2.5 Costs
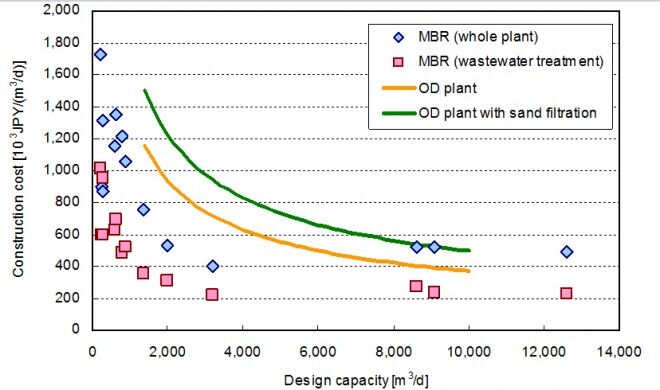
Construction costs for the 15 small-scale MBR plants (1−10, 12−14 and 16−17, Table 1) decreased sharply with design capacity before stabilising at around 3,000 m3/d (Figure 3) to 0.2 million JPY/(m3/d). Almost all data points lay below the corresponding cost curves for the commonly-used oxidation ditch (according to Japanese cost function), though costs for the whole MBR plant were comparable to those of the oxidation ditch with tertiary sand filtration for large design capacities.
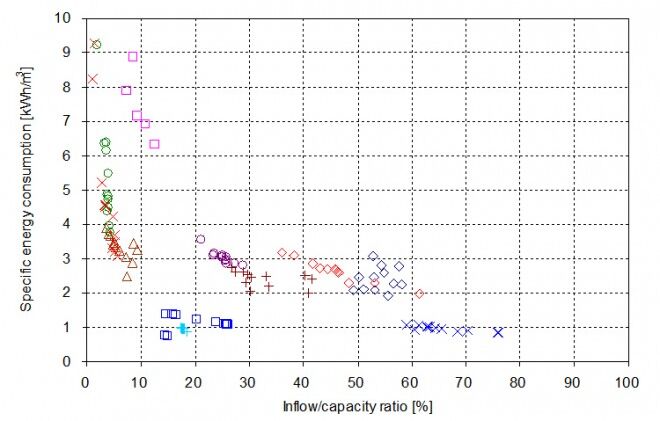
The monthly averaged specific energy consumption (encompassing fine screening, flow equalization, mixing, recirculation, filtration and aeration) for the 11 reviewed MBR plants (No. 1, 2, 4−10, 12 and 13 in Table 1) was recorded as a function of the inflow/capacity ratio, or utilisation (Fig. 4). The trend reveals the expected decrease in energy demand with % utilisation, particularly between 1 and 10−12%. Significant differences in the range of energy consumption were recorded between the different plants with comparable inflow/capacity ratio. If the low-loading data is omitted (utilisation <12%), the specific energy consumption values range from 0.8 to 3.2 kWh/m3. These are in the range of reported values for full-scale municipal MBR plants worldwide (Krzeminski et al, 2012).
Against this, the specific energy consumption for the demonstration plant No.11 (Fig. 5) was only 0.47 kWh/m3 on the annual average basis and 0.39 kWh/m3 operated at full-capacity operation for which membrane aeration and process aeration respectively accounted for 72% and 25% of the total energy. Use of air-lift pumps reduced the energy demanded by internal recirculation to only 1%. The total energy demand values are comparable to those reported for the most energy efficient plants (Judd and Judd, 2010).
3. Conclusions
The MBR plants selected for the survey performed well in terms of carbon and nitrogen removal, although incorporation of EBPR seemed to be challenging when operated with primary sedimentation. Membranes at extremely under-loaded plants were operated intermittently. Recovery cleans were applied mainly between 1 and 5 times annually. A cost evaluation revealed the specific construction cost for the small-scale MBRs was lower than that of classical oxidation ditches. Although the specific energy consumption was high for under-loaded MBRs, it was demonstrated that a specific energy demand below 0.4 kWh/m3 was attainable under optimal operating conditions at full flow.


