Reuse of dairy wastewater treated by membrane bioreactor and nanofiltration: technical and economic feasibility

Laura Hamdan de Andrade, Flávia Daniele dos Santos Mendes, Jonathan Cawettiere Espindola, Míriam Cristina Santos Amaral
Department of Sanitary and Environmental Engineering, Federal University of Minas Gerais, Av. Antônio Carlos, nº 6627, Pampulha, Belo Horizonte, Minas Gerais, Brazil
1. Introduction
The dairy industry has great importance in both the national Brazilian and global economy. Brazil is the sixth largest milk producer worldwide and has the potential to become one of the largest exporters of dairy products due to its competitive advantages, including water and land availability and low production cost. However, for this to become a reality, the national dairy industry needs to add value to its products and find more efficient and sustainable production processes to be more competitive in foreign markets.
Specifically, the key issue of sustainable water supply needs to be addressed. Brazil, like many other countries, suffers from regional water shortages even though as a whole the country appears to have a stable water supply. Closer scrutiny of regional water reuse opportunities are therefore needed in order to conserve freshwater supplies. A study carried out by Andrade and co-authors assessed the viability of a two-stage membrane bioreactor−nanofiltration scheme (MBR−NF) for treating dairy wastewater. Of key concern was the quality of the treated water with respect to its potential reuse and the overall cost of the scheme.
2. Dairy industry wastewater
The wastewater used came from a large Brazilian dairy factory in the state of Minas Gerais that produces UHT milk, yogurt, ‘minas’ cheese, requeijão (cream-cheese), and petit suisse. The factory’s milk processing capacity is 800 m3/day. Around 77% of the effluent comes from CIP (clean in place) operations and 23% from the utilities (cooling and heating systems), cleaning of external areas, laundry and wastewater from the administrative buildings toilets. The existing wastewater treatment system comprises screening, dissolved air flotation and activated sludge biological treatment. The effluent used in this study was collected after the screening and DAF stages.
3. Experimental apparatus
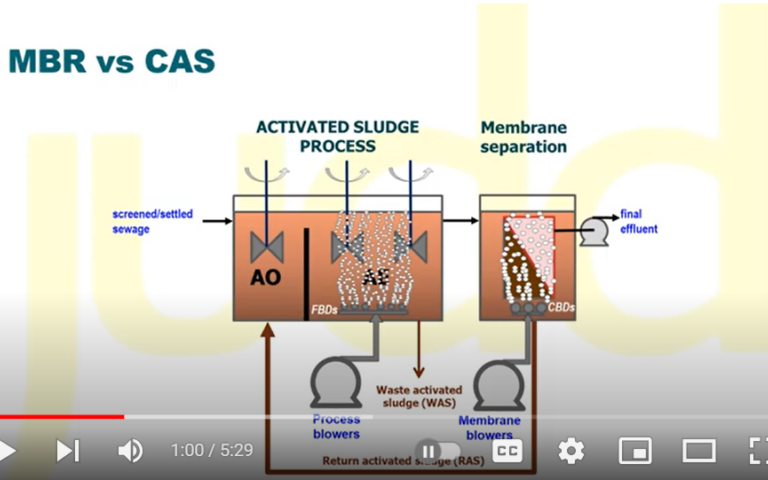
A bench-scale MBR−NF system was constructed based on a PAM Selective Membranes (Rio de Janeiro, Brazil) 0.044 m² polyetherimide hollow fibre (HF) membrane module with a 0.5 µm pore size and a clean water permeability of 177 L/(h.m2.bar). The system employed a 13.4 L feed storage tank, a 4.4 L biological tank and two 4.0 L permeate storage tanks. Permeation was by extraction of the permeate using a vacuum pump with a diaphragm pump used for backflushing (Fig. 1).
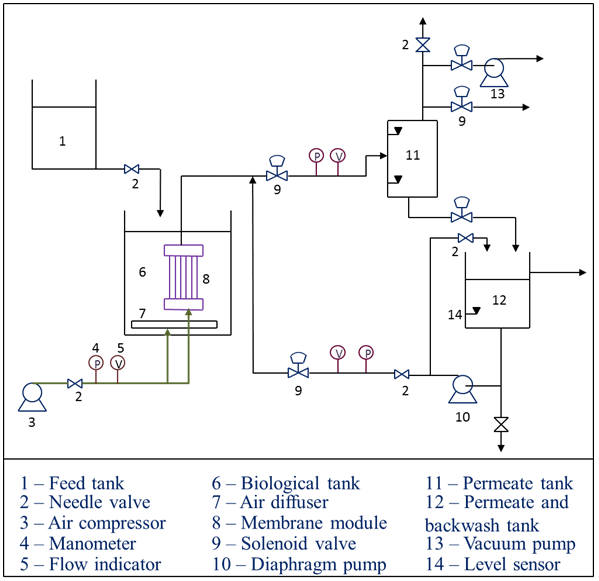
The MBR was inoculated with sludge from the activated sludge tank of the full-scale plant. Following a 28-day acclimatization period the system was operated continuously for 40 days at a hydraulic retention time (HRT) of 6 hours and a sludge retention time of 60 days at a flux of 16 LMH. A single aerator, operating at 1 Nm³ air/h, was used for both process aeration and membrane scouring with backflushing at 45 LMH for 15 seconds every 15 minutes of permeation. Over the 40-day operation period of the MBR the critical flux was determined four times by the TMP-step method, following chemical cleaning on each occasion, using a filtration time of 18 minutes and flux steps of 0.05 bar. The critical flux corresponded to the value that flow reduction was observed during the 18 minutes of permeation at constant pressure.
The NF testing (Fig. 2) was based on an NF90 membrane (Dow-Filmtec) in a flat-sheet test cell providing a membrane area of 0.0062 m2, and employed batches of MBR permeate as the feedwater. The membrane clean water permeability was 2.3 L/(h.m2.bar). Filtration was at 10 bar with a cross-flow velocity of 7.8 m/s and a permeate recovery rate of 45%. The critical flux was measured using 5 bar pressure step increments.
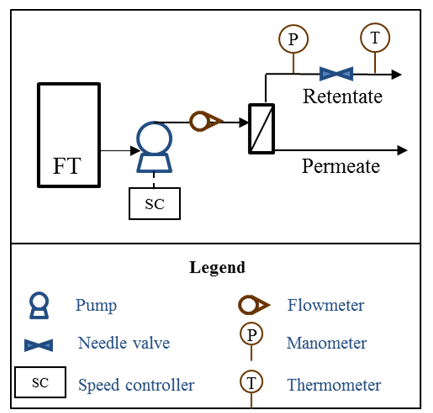
The raw wastewater, MBR permeate, NF permeate and NF retentate were analyzed for COD, colour, and total solids. The NF permeate was further analyzed for pH, alkalinity, total dissolved solids, COD, and metals to assess its suitability for utility water.
4. Economic feasibility
The net present value (NPV), the internal rate of return (IRR), and the payback period for the investment were calculated based on a 15-year period:
where S is the profit or loss in the year (cash flow), i is the interest rate considered, and t is the number of years. The IRR is given by the interest rate i at zero NPV. The payback is given by the time in years at which the aggregated S becomes positive (i.e. the total cost moves from deficit to surplus). The influence of membrane lifespan was evaluated based on a membrane replacement frequency of 1−7 years for both the MBR and NF membranes. Calculations were based on a wastewater flow of 1,000 m3/d and a 45% recovery for the NF (i.e. 450 m3/d of permeate), the recovered water being reused in the factory for cooling and boiler feedwater, and washing operations.
Costs for reuse were compared with those for drinking water supply and discharge to sewer following the conventional treatment system. The NF retentate wastewater stream from the reuse scheme was assumed to be discharged to sewer – at a lower cost per m3 than that incurred by discharge of the effluent from the conventional process due to its reduced organics concentration (75 mg/L COD cf. 180 mg/L). Similarly, the water supply costs to the factory are reduced by the recovery of 450 m3/d of the wastewater.
The costs considered (Table 1) related to the initial investment, labour (one engineer and four technicians-operators), treatment and disposal of the MBR sludge (based on a solids retention time of 60 days), energy consumption, chemicals for membrane cleaning, maintenance and membrane replacement. Initial values were adjusted at a rate of 4.5% per year for subsequent years, this being the inflation target for Brazil. Membrane costs were obtained from estimates from two commercial membrane suppliers and the membrane area requirement determined based on a permeate flux of 15 L/h.m² for both MF and NF. Labour costs were based on payment of 13 annual salaries plus 70% for taxes and labour charges.
| Item | Value |
|---|---|
1 RS$ = 0.3 USD | |
| Initial unit cost | R$ 5,000,000.00 |
| Monthly salary of an engineer professional | R$ 4,500.00 |
| Monthly salary of a technical professional | R$ 2,500.00 |
| Sludge disposal | R$ 7.72/m3 |
| Electricity rate (daily average cost per kW) | R$ 11.86/kW |
| Electricity rate (daily average cost per kWh) | R$ 0,20507/kWh |
| Treated water rate | R$ 6.881/m3 |
| Wastewater disposal in public sewage system rate | R$ 6.193/m3 |
| High COD and TSS load wastewater disposal rate, conventional scheme | R$ 20.68 |
| Low COD and TSS load wastewater disposal rate, reuse | R$ 6.19 |
| Environmental value added | R$ 0.06/m3 |
| Maintenance | 5% of initial investment |
| Chemical agents for membrane cleaning | 2% of initial investment |
| Microfiltration membrane replacement | R$ 280/m2 |
| Nanofiltration membrane replacement | R$ 400/m2 |
The prices for water supply and wastewater discharge to sewer were obtained from a water utility (COPASA) based on an industrial water consumption of 1,000 m3/d; industrial effluent discharge costs are determined by the COD and TSS load in Brazil (the ‘polluter pays’ principle). The difference in COD load was equated to a value of US$ 0.1312 per kg of COD discharged. Energy consumption values of 0.54 kWh/m³ for the NF and 1.1 kWh/m³ for the MBR were applied, based on costs provided by the energy utility for continuous supply.
A sensitivity analysis was completed for the rate of treated water and effluent discharge, to assess the impact of these variables on the economic evaluation. Rates of between 2 and 12 R$ (0.6−4 USD) per m3 of water were considered for a membrane lifespan fixed at five years. The effluent discharge rate was considered to be 90% of the rate charged per m3 of treated water, according to water utility COPASA. The NPV and the IRR were calculated for each condition.
5. Results
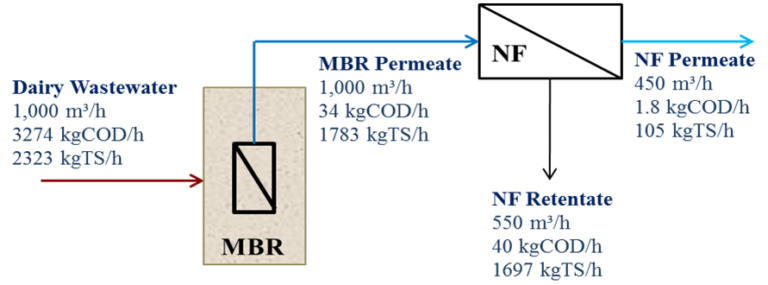
Results showed the MBR to remove around 99% of the COD (Figure 3). The NF removed 88% of residual COD (Table 2). Values of the dissolved parameters in the NF permeate were within those required for cooling and low pressure boiler feed, whereas the alkalinity and calcium concentrations exceeded those demanded for medium pressure boiler water feed (Table 3). The NF retentate water quality was found to be sufficiently high to allow its direct discharge to the environment without treatment. Sustainable fluxes of 15.9 and 18.5 LMH respectively for the MBR and NF process technologies were assumed, based on measured critical fluxes of 21.6 and >25.1 LMH.
| Dairy effluent | MBR permeatea | NF permeatea | Global system efficiency | |
|---|---|---|---|---|
a Values in parentheses correspond to the removal efficiencies of MBR and NF | ||||
| COD (mg/L) | 3274 | 34 (99%) | 4 (88%) | 100% |
| Color (Hu) | 2163 | 35 (98%) | 15 (58%) | 99% |
| TS (mg/L) | 3366 | 1783 (47%) | 233 (87%) | 93% |
| Alkalinity (mg/L) | 641 | 1167 (−82%) | 166 (86%) | 74% |
| TN (mg/L) | 115 | 12 (89%) | 7 (40%) | 94% |
| Sodium (mg/L) | 606 | 600 (1%) | 69 (89%) | 89% |
| pH | 7.72 | 9.05 | 8.99 | − |
| Parameter | NF permeate | Cooling water | Steam generation: < 10 bar | Steam generation: 10 to 50 bar |
|---|---|---|---|---|
TDS − Total Dissolved Solids | ||||
| TDS (mg/L) | 233 | 500 | 700 | 500 |
| Alkalinity (mg/L) | 166 | 350 | 350 | 100 |
| pH | 8.99 | 6.9 to 9.0 | 7.0 to 10.00 | 8.2 to 10.00 |
| COD (mg/L) | 4.0 | 75 | 5.0 | 5.0 |
| Calcium (mg/L) | 0.44 | 50 | + | 0.40 |
| Magnesium (mg/L) | 0.041 | 0.5 | + | 0.25 |
| Copper (mg/L) | 0.04 | + | 0.5 | 0.05 |
| Zinc (mg/L) | <0.1 | + | + | 0.01 |
| Iron (mg/L) | 0.05 | 0.5 | 1.0 | 0.30 |
6. Economic feasibility of reuse of treated wastewater
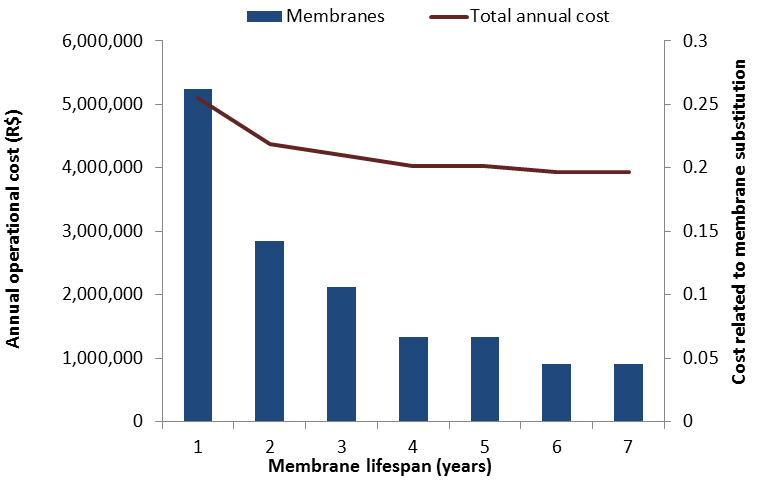
Operational costs with respect to membrane replacement become significantly less after a membrane life greater than four years (Figure 4). This is also reflected in the cost of the treated wastewater (Table 4). The proportion of the cost from membrane replacement decreases to around 4% for a membrane life of seven years. The greatest contribution to the cost is that of energy, at around 70% for a membrane life of seven years.
| Lifespan of membrane modules (MF and NF) | 1 year | 2 years | 3 years | 4 years | 5 years | 6 years | 7 years |
|---|---|---|---|---|---|---|---|
| Cost (R$/m3 of treated wastewater): | |||||||
| Initial investment | 0.91 | 0.91 | 0.91 | 0.91 | 0.91 | 0.91 | 0.91 |
| Labor | 0.92 | 0.92 | 0.92 | 0.92 | 0.92 | 0.92 | 0.92 |
| Electricity | 8.35 | 8.35 | 8.35 | 8.35 | 8.35 | 8.35 | 8.35 |
| Maintenance | 0.72 | 0.72 | 0.72 | 0.72 | 0.72 | 0.72 | 0.72 |
| Chemicals | 0.29 | 0.29 | 0.29 | 0.29 | 0.29 | 0.29 | 0.29 |
| Sludge | 0.03 | 0.03 | 0.03 | 0.03 | 0.03 | 0.03 | 0.03 |
| Membranes | 3.66 | 1.71 | 1.22 | 0.73 | 0.73 | 0.49 | 0.49 |
| Total | 14.87 | 12.92 | 12.43 | 11.95 | 11.95 | 11.70 | 11.70 |
Figure 5 shows the values of NPV for the implementation and operation of the MBR and NF wastewater reuse system as a function of the opportunity cost (the minimum return expected by the investor) and the lifespan of the membrane modules.
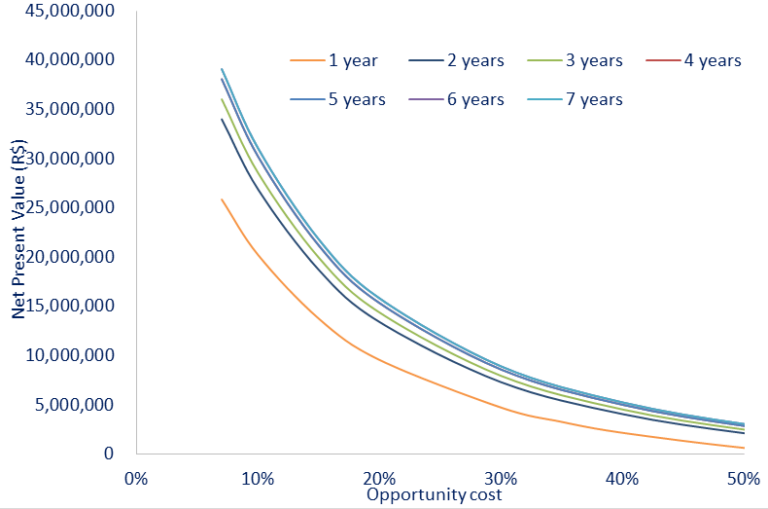
The net present value (NPV) was found to be positive at an opportunity cost of 50% even for a one-year membrane life. For an opportunity cost of 15%, based on membrane replacement every two years, the NPV is R$ 18,697,784, a value that could be considered quite high and attractive. For a seven-year membrane life, the NPV at an opportunity cost of 15% would be 17% greater at R$ 21,789,457. The IRR against membrane life (Table 6) is similarly attractive at around 56 to 78%.
| Membrane lifespan (years) | IRR (% per year) | Payback (years) |
|---|---|---|
| 1 | 56.0 | 2 |
| 2 | 69.7 | 2 |
| 3 | 73.2 | 2 |
| 4 | 76.6 | 2 |
| 5 | 76.6 | 2 |
| 6 | 78.3 | 2 |
| 7 | 78.3 | 2 |
Since the profit from the implementation of the reuse system is derived principally from the savings in the purchase of treated water from the local utility companies and from the discharge of the wastewater to the sewage collection system, the ‘cost of water’ has a large influence on the economics. Thus, to verify the effects of the price of treated water on the economic assessment of the system, a sensitivity analysis was performed for this variable. Rates of R$2.00−12.00 per m3 of water, consistent with typical Brazilian water prices, were considered. The membrane lifespan was fixed at five years, the rate for wastewater disposal considered to be 90% of the rate of treated water, and no high COD extra-charge was considered. NPV values calculated as a function of these different rates and different opportunity costs are presented in Figure 6.
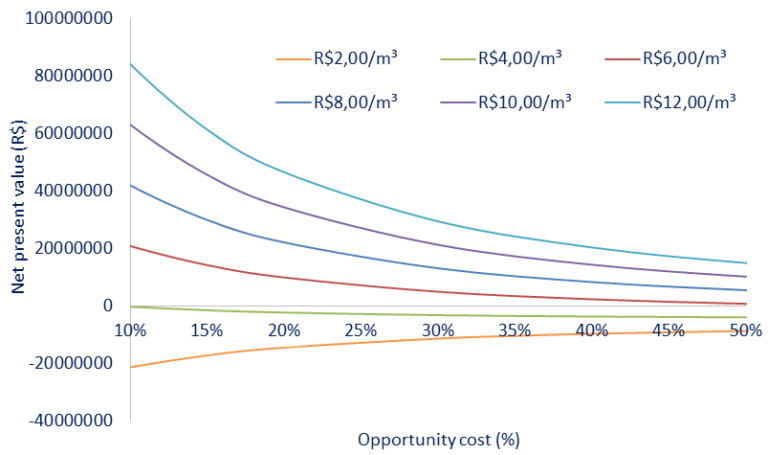
The large impact of water value is clearly demonstrated, with the opportunity NPV increasing more than four-fold on duplicating the value from R$6.00/m3, at an opportunity cost of 15%, to almost R$62m − indicating a highly attractive investment. The price of water used is similar to those offered by SABESP (Basic Sanitation Company of the State of São Paulo), and in several municipalities in the metropolitan region of São Paulo companies consuming more than 50 m3/month pay ~R$13 per m3 water.
The revenue gained through environmental valuation (R$21,900.0/year) corresponds to only 0.5% of the total annual revenue when the cost of treated water is R$4.00/m3 and 0.2% when it is R$12.00/m3. Even though this revenue is insignificant when compared to the others, it is still important with reference to environmental resourcing. Environmental valuation permits, estimation of the willingness of society to pay for the preservation or conservation of resources and environmental services, assisting in making decisions which may be based as much on social and environmental factors as economic ones. Notwithstanding this, the internal rate of return and the payback period of the investment are both highly favourable (Table 6), even at a water rate of 6 R$/m3.
| Rate (R$/m3) | IRR (%) | Payback (years) |
|---|---|---|
| 2.0 | − | − |
| 4.0 | 9,4 | 9 |
| 6.0 | 57,5 | 2 |
| 8.0 | 100,8 | 2 |
| 10.0 | 144,0 | <1 |
| 12.0 | 187,3 | <1 |
7. Conclusion
The treatment process evaluated (MBR combined with NF) permits reuse of dairy industry wastewater as utility water for low-pressure boilers, cooling towers, and washing floors and outside areas. The NF retentate also complies with legislative parameters for the disposal of wastewater in water bodies. It is also economically viable to reuse the treated wastewater provided the water supply cost is above R$4.00/m3. Membrane life is a key factor in determining cost benefit, however, the total cost of the treatment by the proposed treatment system ranging from R$14.87/m3 to R$11.70/m3 depending on membrane lifespan.


