Reducing process aeration energy consumption in MBRs

Jianyu Suna, Peng Lianga, Xiaoxu Yana, Kuichang Zuoa, Kang Xiaoa,b, Junlin Xiaa, Yong Qiua, , Qing Wua, Shijia Wua, Xia Huanga, Meng Qia, Xianghua Wena
a State Key Joint Laboratory of Environment Simulation and Pollution Control, School of Environment, Tsinghua University, Beijing 100084, China
b College of Resources and Environment, University of Chinese Academy of Sciences, Beijing 100049, China
1. Introduction
It is known that MBRs use more energy compared with classical activated sludge (CAS) because the aeration requirements are greater. Aeration is needed both for the biological and membrane tanks for degrading the organics and scouring the membrane respectively. Typically, aeration energy consumption accounts for 70−80% of total energy used for the municipal wastewater treatment process, with 40−60% consumed by the process biology. Clearly, using less air can go some way towards reducing the operating costs.
Aeration optimization can be achieved by regulation of blowers, including by altering the angle of the guide vanes for fixed-frequency blowers or by altering the frequency of the alternating current for variable-frequency blowers. Aeration can be controlled on the basis of process parameters such as mixed liquor suspended solids (MLSS) and/or dissolved oxygen (DO) concentrations, oxidation-reduction potential (ORP), with DO-based aeration control normally favored for reducing energy consumption. However, low DO levels can also impair effluent quality: maintaining DO concentrations at a so-called ‘optimal’ level during operations can still lead to real-time fluctuations in effluent quality under conditions of changing feedwater quality. A feedback control mechanism should therefore be based on effluent quality directly, rather than DO levels in the mixed liquor. This then requires the appropriate quantitative relationship to be developed between effluent quality and aeration rate.
The relationship should itself be precise and simple enough for calculation that allows real-time control, rather than the most often used activated sludge model (ASM) which has multiple differential formulae. If a straightforward empirical relationship is applied, which is simple in terms of calculation but broadly corresponds to the complete ASM, then real-time feedback control based on this algorithm would be possible.
The classical ASM has to be modified for the longer solid retention time (SRT) and correspondingly lower food-to-microorganisms (F/M) ratio of an MBR compared to a CAS, which produces significant differences in kinetic parameters between MBR and CAS. The MBR further has near-saturated DO concentrations in the membrane tanks from the membrane scouring. The return of this sludge to the biological tank represents another difference between the MBR and CAS.
This study aimed to reduce aeration energy consumption in a large-scale MBR via process simulation and engineering application, first by using a suitably calibrated, MBR-adapted ASM model and then by employing an effluent-quality-based feedback control strategy for biological aeration using two-step cascaded proportion-integration (PI) control. This involved establishing a simple mathematical relationship between aeration and effluent quality, which fitted the ASM. The strategy calculated a DO set-point from mixed liquor ammonia concentrations, then adjusted the blowers accordingly. The algorithmic parameters were optimized by model simulation before applying the control strategy to a full-scale MBR to determine the actual energy saving.
2. Experimental
2.1 Full-scale MBR
The modelling was validated using a 50,000 m3/d MBR installed at Wuxi (commissioned in January 2012 and operating at full capacity since 2013) in the Jiangsu Province of China. It is configured for biological nutrient removal by the modified A2/O-MBR process and challenged with combined municipal and industrial effluents. The MBR process was operated at hydraulic and solid retention times of 13 h and 15 d, respectively, and the installed hollow fiber membrane was a 0.2 μm pore hydrophilic polyvinylidene fluoride (PVDF) membrane supplied by OriginWater (China).
The overall process (Fig. 1) comprised four lines of 12500 m3/d capacity, with an anoxic tank, an anaerobic tank, an interchangeable A/O tank, an aerobic tank and membrane tanks. DO and ammonia-N probes were placed at the ends of the aerobic tanks to monitor DO and ammonia-N. An electromagnetic flow meter was placed at the influent pump to monitor the flow rate.

Three high-speed centrifugal blowers, providing 4800 m3/h at 68.6 kPa with a nominal power of 132 kW and operated as 2:1 or 1:2 duty:standby depending on the temperature, were installed for aeration in aerobic tanks. The aeration flow rate could be adjusted by changing the opening angle of the guide vane, achieving an aeration range of 60−100% of maximum flow rate.
2.2 Software for modeling and simulation
‘Biowin’ software with Activated Sludge Model 2d (ASM2d) was used to simulate the treatment process. The membrane unit was described as a biological tank with 100% and 95%, rejection of particles and colloids respectively. The software permitted steady-state and dynamic-state simulation, with various control strategies.
2.3 Establishment of the full-scale MBR model
Flows were set according to full-scale installation, with sludge recirculation ratios of 500% from M to Ae, 100% from Ae to A2, and 200% from Ae to X. The anoxic zones were set up with zero aeration (DO = 0 mg/L), and Ae with constant-flow aeration. The total aeration flow rate was set at 2400 m3/h (in winter) and 1200 m3/h (in summer), according to the actual operation of blowers. The aeration distribution ratio of X to O was 0.15:0.85.
2.4 Parameter calibration
The ASM2d model was simplified by conducting a sensitivity analysis to establish which of the 45 kinetic parameters and 22 stoichiometric parameters defining the 21 biological and chemical reactions significantly affected the simulated outputs. The resulting parameters were then manually adjusted until the simulation result was acceptably close to experimental results.
The streams were characterized as follows so as to populate the model appropriately:
- Continuous 1−2 hourly sampling of the anoxic tank influent and membrane permeate for one week, with samples measured for chemical oxygen demand (COD), biological oxygen demand (BOD5), ammonia-N, total nitrogen (TN), phosphate, total phosphorus (TP), and suspended solids (SS).
- Sample and mixed liquor (sampled daily) fractionation via 0.45-μm membrane filtration, the filtrate being measured for COD, TN, and TP according to standard methods and the mixed liquor monitored for temperature, pH and DO.
- Hourly monitoring of the influent flow rate.
2.5 Aeration control strategy
A two-step cascade control system was designed for aeration control in aerobic tanks. The deviation of the aerobic tank ammonia-N concentration from the setpoint was used to calculate the DO deviation, and so adjust the aeration demand. The calculation procedure from DO to aeration was linked to that from ammonia-N to DO in a cascaded structure (Fig. 2). The pre-calibrated full-scale MBR model was employed as a referee platform for the optimization of the algorithmic parameters used for the aeration control strategy. Optimization was conducted by incorporating the control-strategy algorithm into the MBR model, with parameters refined iteratively via tentative calculations. Theoretically, an ideal set of parameters in this platform should give constant ammonia-N concentrations in the aerobic tank.
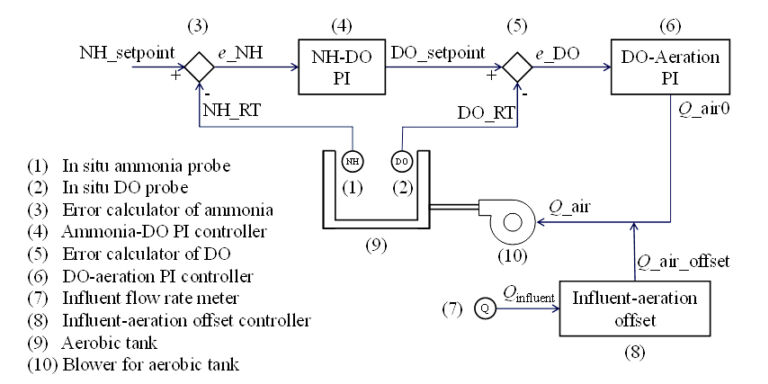
For optimization, the influent conditions used in the simulation were randomly generated, compared to the normal range of these parameters in the WwTP. The algorithmic parameters were considered optimal when the calculated ammonia-N concentrations in the aerobic tank were acceptably stable. The energy saving potential was then evaluated by comparing simulated aeration flow rates obtained with and without the aeration control strategy. The control strategy, programmed in C# language, was then installed into the central control system of the MBR.
3. Results and discussion
3.1 Long-term monitoring of energy consumption of the full-scale MBR
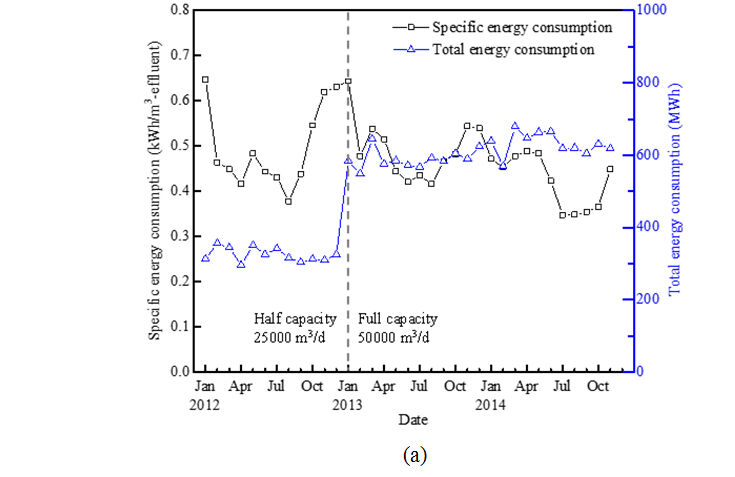
Stable pollutant removal has been achieved since commissioning, with mean COD, BOD5, N-NH4+ and TN effluent levels of 19, 3.0, 1.0 and 12 mg/L compared with influent values of 250, 80, 27 and 30 mg/L respectively. Specific energy consumption since 2013 had ranged between 0.35–0.65 kWh/m3 effluent (Fig. 3a). The mean value of 0.47 kWh/m3 is lower than those reported for European MBRs (0.8–2.4 kWh/m3) but slightly higher than the figures of 0.39−0.43 previously reported for fully optimized MBRs in Singapore and Japan.
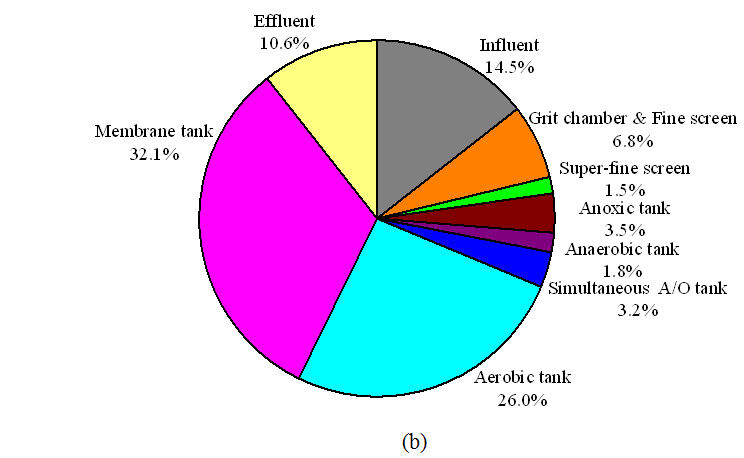
Energy consumption varied seasonally, maintained at the lowest levels predominantly from April to September. The energy consumption distribution since 2012 (Fig. 3b) indicates that nearly 60% was consumed in aerobic tanks and membrane tanks, the mean ratio being 0.85:1.
3.2 Biological model calibration
A sensitivity analysis indicated the significant impact of maximum growth rate and aerobic decay rate of ammonia oxidation bacteria (AOB) and nitrite oxidation bacteria (NOB) on ammonia levels, and maximum growth rate, aerobic decay rate and yield coefficient of heterotrophic bacteria (HB) on BOD, COD and TN. These parameters, largely affected by the low F:M ratio compared with the CAS process on which the model is based, were manually calibrated according to experiments and references (Table 1). The alpha factor was set to 0.75 according to an oxygen-transfer experiment.
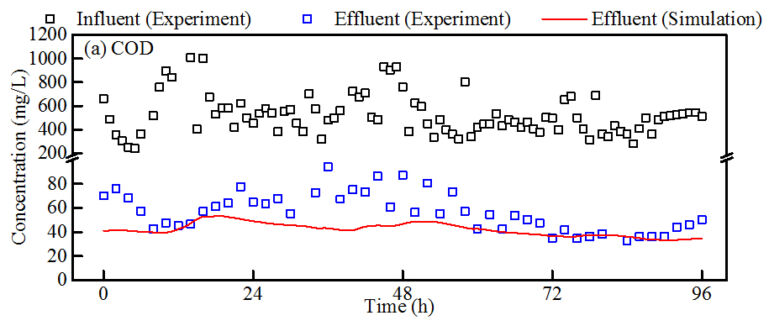
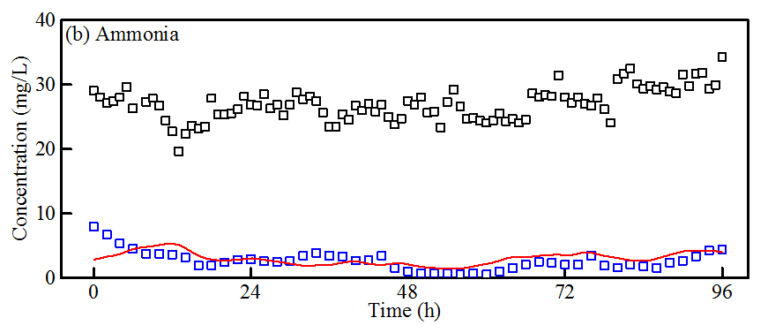
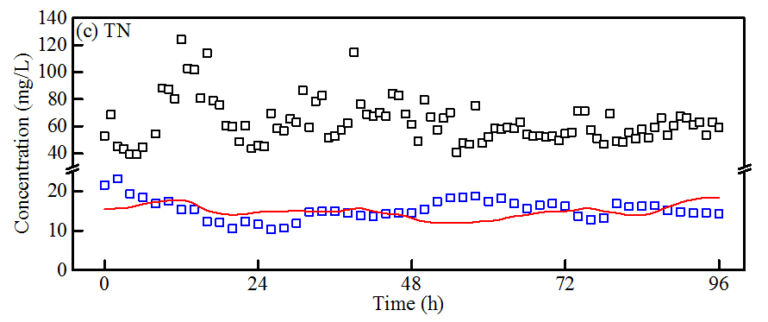
The model simulation was conducted with calibrated parameters under dynamic-state simulation conditions and results compared with data from the full-scale MBR (Fig. 4). The simulation result of COD acceptably matched the experimental monitoring on the variation trend with an average deviation of 14.2 mg/L. Simulation was limited by the use of constant values of the COD fractions, whereas in practice they were subject to variation during the intermittent industrial effluent discharges. Ammonia-N and TN removal were accurately represented by the model, with average deviation of 0.36 mg/L (12%) and 0.44 mg/L (3%), respectively. TP removal was excluded since influent TP and soluble TP concentrations were extremely low.
| Parameter | Unit | Default value | Calibrated value |
|---|---|---|---|
Abbreviations: AOB, ammonia oxidation bacteria; COD, chemical oxygen demand; HB, heterotrophic bacteria; NOB, nitrate oxidation bacteria; TKN, total Kjeldahl nitrogen; TP, total phosphorus. | |||
| Soluble undegradable CODa | gCOD/gTCOD | 0.05 | 0.07 |
| Ammoniaa | g-Ammonia-N/gTKN | 0.66 | 0.495 |
| Particle organic Na | g-Ammonia-N/g-Organic-N | 0.50 | 0.394 |
| Phosphatea | g-Phosphate-P/gTP | 0.5 | 0.022 |
| Soluble undegradable TKNa | g-Ammonia-N/gTKN | 0.02 | 0.08 |
| Maximum growth rate (AOB)b | d-1 | 0.9 | 0.72 |
| Aerobic decay rate (AOB)b | d-1 | 0.17 | 0.23 |
| Maximum growth rate (NOB)b | d-1 | 0.70 | 0.50 |
| Aerobic decay rate (NOB)b | d-1 | 0.17 | 0.23 |
| Maximum growth rate (HB)b | d-1 | 3.20 | 2.80 |
| Aerobic decay rate (HB)b | d-1 | 0.62 | 0.70 |
| Anoxic decay rate (HB)b | d-1 | 0.23 | 0.25 |
| Yield coefficient (HB)b | – | 0.666 | 0.40 |
| Alpha factorc | – | 0.5 | 0.75 |
3.3 Evaluation of energy saving potential of the aeration control strategy
The calibrated model could simulate the wastewater treatment process at a constant aeration flow rate, but not conversely derive the real-time aeration demand from the influent conditions and effluent requirements. Therefore, a straightforward empirical and process-specific relationship was required to provide this for real-time process control, and a feedback algorithm was implemented to extract from the model a relationship based around effluent characteristics.
The aeration control strategy used in this study was an in-situ ammonia-N-based feedback control with influent-flow-rate-based feedforward control. The control strategy was first tested in Biowin language to establish the energy saving potential under representative dynamic conditions of variable feedwater quality and two different temperatures of 13 and 26 °C to represent winter and summer conditions respectively (Fig. 5).
Under these simulated conditions the aeration control strategy varied was found to reduce the aeration flow rate by 15% and 20% in winter and summer, respectively. Although the aerobic tank ammonia-N concentration increased slightly, the effluent level was stable at 5 mg/L and the target TN concentration of 15 mg/L was also achieved. At the highest temperature the ammonia-N concentration standard deviation decreased from 29.2% to 10.4%, while that of influent was 19.2%, indicating more stable effluent characteristics under aeration control. The appropriate parameter values for process control were extracted from the simulation for application to the full-scale plant for controlling aeration by adjusting the angle of the guide vane in the blowers.


3.4 Full-scale plant
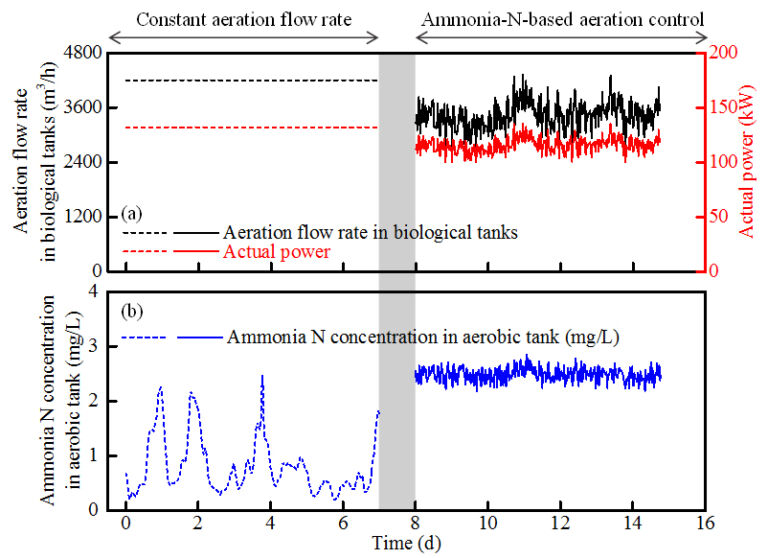
Short-term monitoring of the full-scale MBR was performed during the operation of the aeration control strategy for two weeks, focusing on the aeration output of blowers, actual power of blowers, and variation of ammonia-N concentration (Fig. 6). On applying the aeration control strategy, the aeration flow rate decreased by 20% and blower power by 14%. The ammonia-N concentration in the aerobic tank increased but was still lower than the 5 mg/L target. This equated to a 4% reduction in overall energy consumption, from an already-low value of 0.47 kWh/m3, and a projected annual energy saving of 142 MWh. At this energy saving and assuming the price of power for industrial use in China of 0.6‒0.9 RMB/kWh, a payback of 0.9‒2.8 years was estimated for fitting the appropriate ammonia probes for implementing the control strategy. A higher energy reduction rate (of 5‒5.5%) and correspondingly shorter payback period would be expected if variable-frequency blowers were to be fitted.
4. Conclusion
This study demonstrated that a 20% reduction in biological aeration rate could be achieved by implementing process aeration control based on ammonia concentration rather than the classical dissolved oxygen-driven process control. The corresponding 4% reduction in energy demand to 0.45 kWh/m3 was achieved based on fixed-frequency rather than variable-speed frequency blowers, where energy savings would be expected to be higher due to the more energy-efficient adjustment of air flow rate. Whilst the energy saving may appear small, it equates to an increase in net membrane flux of double this percentage value and demands only minor capital investment to achieve.


