Pathogen removal by microfiltration MBRs

The authors measured the extent of rejection of pathogens by flat sheet microfiltration membranes in a full-scale MBR installation at a site where the membranes were ten years old.
Larry Morris1, Amos Branch2, Nicola Fontaine2, Andrew Salveson2, Chad McBride3, Hiro Kuge1, Andrew Gilmore2, and Yasushi Terao1
1Kubota Membrane USA Corp., 2Carollo Engineers, Inc., 3Nevada County Sanitation
1. Introduction
Pathogen removal is a key performance criterion in indirect and direct potable reuse, or IPR and DPR respectively. Generally, national-, and often state-, level guidance exists defining the testing required to quantify the pathogen removal performance of treatment technologies. The activities in demonstrating the level of pathogen removal are generally grouped under the term 'validation'. Validation guidance documents contain the essential items to be tested (e.g., target pathogens and indicator microorganisms), test frequency, duration, as well as recommended quality assurance.
Potable reuse treatment schemes utilize a number of treatment technologies in series to manage risks due to pathogenic and chemical hazards originating from wastewater. In California, a typical membrane-based reuse scheme for indirect potable reuse (IPR) will start with wastewater treatment prior to downstream treatment technologies, such as membrane filtration (microfiltration/ultrafiltration (MF/UF) and/or reverse osmosis (RO)), ultraviolet (UV) disinfection, or chlorination coupled with >2 months retention in an environmental buffer (a surface water reservoir or groundwater aquifer).
MBR technology for wastewater treatment provides nutrient removal and substantial rejection of human pathogens and colloidal/suspended solids, producing an effluent suitable as RO feedwater.
Conventionally, pathogen removal is reported as a log reduction value (LRV):
LRV = log10[(Concentration in untreated water)/(Concentration in treated water)] [1]
An LRV of 1.0 thus equates to 90% removal. The total virus LRV for a DPR scheme presently proposed in California is 20, or 99.999999999999999999% removal (CA DDW, 2021), compared with 12 for IPR.
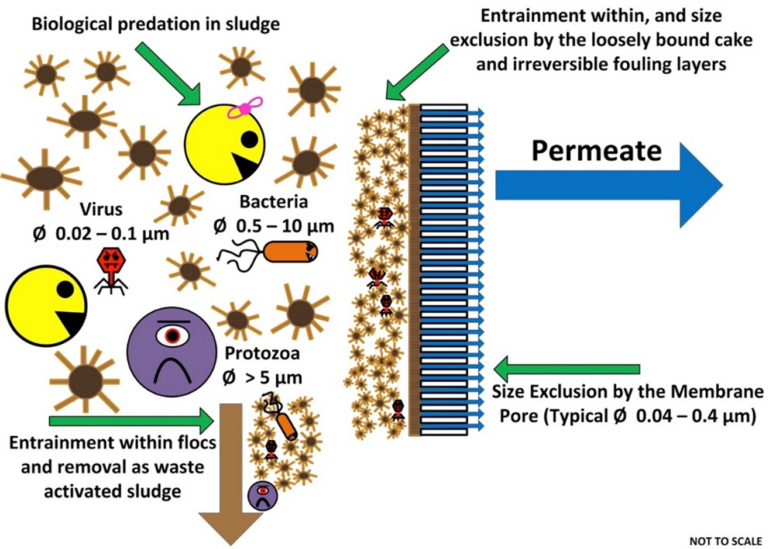
MBRs remove pathogens primarily through size exclusion by the membrane and dynamic fouling layer (often referred to as 'biofilm'), entrainment within the activated sludge flocs, and subsequent wasting and biological degradation in the activated sludge (Hai et al., 2014) (Fig. 1). The multiple simultaneous and pathogen-specific removal mechanisms in MBRs have complicated validation activities undertaken to determine LRVs.
The results in this article follow the guidance for MBR validation outlined as part of Water Research Foundation (WRF) project 4997 (Salveson et al., 2021). WRF4997 was informed by the WaterVal MBR validation guidance that originated from research conducted in Australia between 2014 to 2016 (WaterSecure, 2017). In particular, the WaterVal guidance proposed a Tiered system for MBR validation as a means to pragmatically manage the uncertainty with LRVs due to the pathogen-specific nature of MBR removal mechanisms. The Tiered system, common to both WaterVal and WRF4997, generally follows the approach below:
- Tier 1 – Default LRVs are proposed based on analysis and calculation of a 5th percentile from prior literature data and could be granted to an MBR, conditional on monitoring or operational requirements.
- Tier 2 – System and site specific LRVs are demonstrated for an MBR product at a particular site; the LRVs could then be granted provided the site adheres to a monitoring protocol and performance limits defined during testing.
- Tier 3 – LRV is correlated to a single or set of monitoring parameters (not covered in WRF4997).
WRF4997 proposes Tier 1 MBR LRVs of 1.0 for viruses and 2.5 for protozoa. The WRF4997 Tier 1 MBR LRVs are anticipated to be granted to any flat sheet or hollow fiber MBR with a pore size below 0.4 µm that maintains a 95th percentile filtrate turbidity of <0.2 NTU and never exceeds 0.5 NTU. As a consequence of the WRF 4997 Tier 1 LRVs, a number of MBR + RO + UV/advanced oxidation + chlorination + aquifer storage/recharge schemes are now able to meet the 12 (virus), 10 (Cryptosporidium), 10 (Giardia) log reduction requirements for IPR in California.
Tier 2 MBR validation recommended in WRF4997 outlines a series of validation data collection phases where target pathogens, indicator organisms and membrane integrity surrogates must be monitored. The pre-validation phase can be undertaken at a pilot or full-scale facility and used to determine the LRV for a membrane product that could then be confirmed with site-specific commissioning testing and ongoing monitoring on a later full-scale project. In this study, WRF4997 Tier 2 guidance was followed to validate the Kubota submerged membrane system installed at the Lake of the Pines Wastewater Treatment Plant in Auburn, California. The Lake of the Pines MBR had been operated continuously for 10 years without membrane replacement prior to the validation testing.
Thus far, the impact of long-term operation on LRV at full scale, with the associated cumulative exposure of membranes to cleaning chemicals and the generally harsh activated sludge environment, has not been well documented. The results presented in this article are representative of the LRVs that a well-maintained microfiltration-equipped MBR could be expected to achieve over a long-term period up to the typical design membrane life of 10 years.
The typical operating membrane lifetime prior to membrane integrity failure, impairing filtrate quality, is currently unclear. Membrane and MBR suppliers offer specific lifetime guarantees of around 3−8 years (Le-Clech, 2010). Predictions of membrane life have been made via different methods. From correlation of total membrane throughput with mechanical stability loss of the membrane-module bond, a lifetime of 6.4 years at a mean flux of 11.8 gal/ft2/d, or 8.5 years at 8.8 gal/ft2/d has been proposed (Ayala et al., 2011).
To date, membrane life estimates have been ultimately based on noticeable gross integrity failure, loss of mechanical strength, or production decline. Trends of MBR filtrate microbial quality over long-term operation is an area where little published data exists. In a 10-year study of the Porlock MBR from 1998–2007, average LRVs for Fecal coliforms and male-specific coliphage were reported as >5 and >4 respectively (Nishimori et al., 2010).
2. Materials and methods
Site description
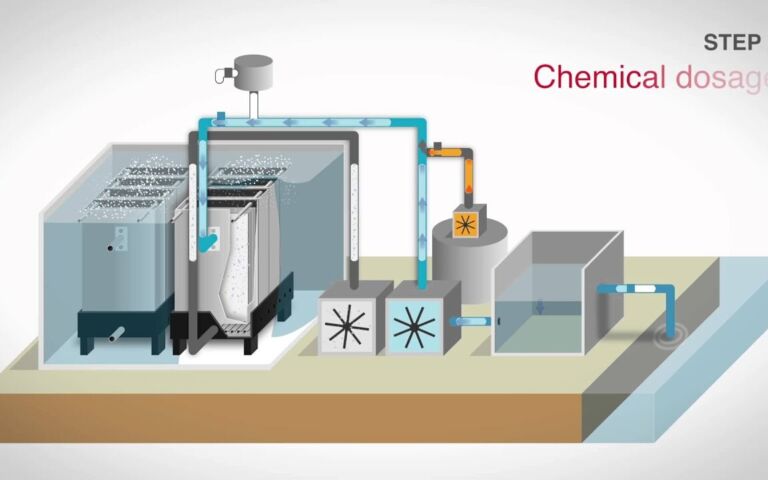
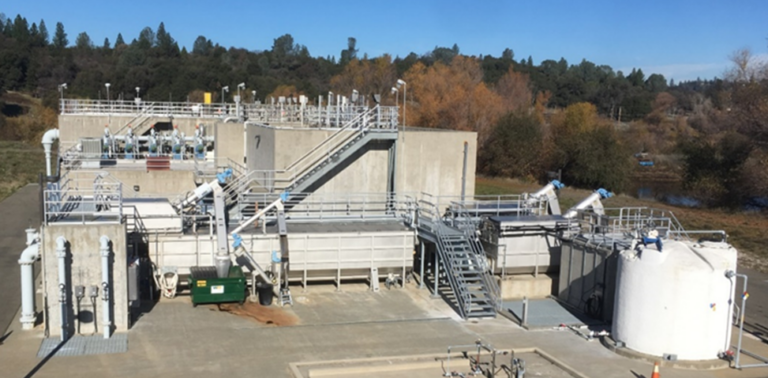
Validation testing of a full-scale MBR facility with flat plate Kubota membrane units was performed at Lake of the Pines Wastewater Treatment Plant (WWTP) in Auburn, California (Fig. 2). The WWTP (Fig. 3) has a maximum monthly flow of 1.4 mgd with a double denitrification process that includes MBR, and UV disinfection prior to creek discharge. A membrane thickener (MBT) is used to further treat and reduce waste activated sludge (WAS) volume.

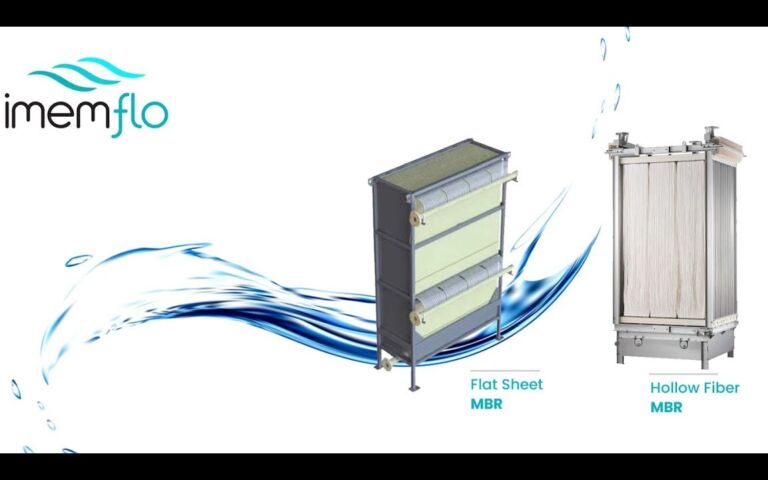
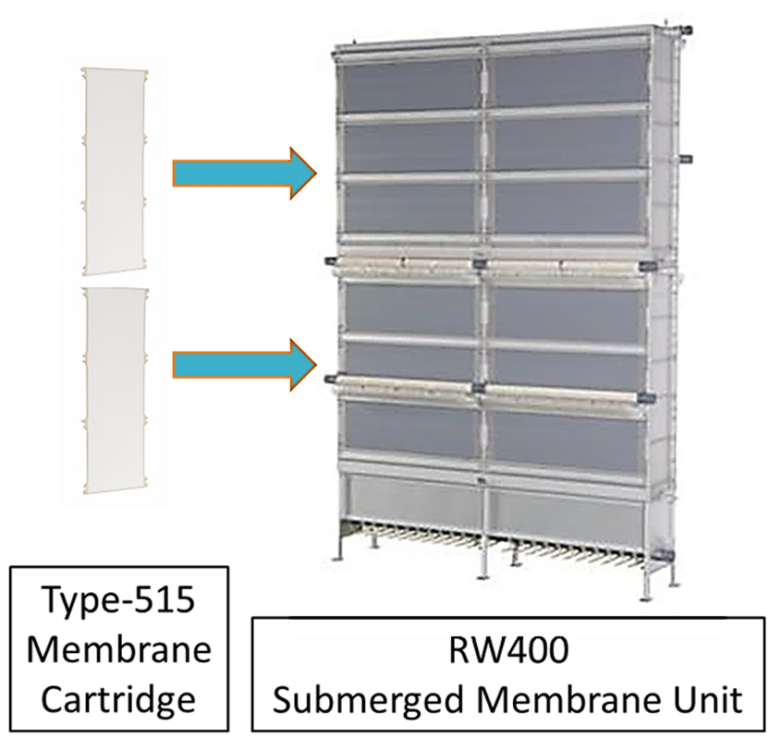
The submerged membrane unit (SMU) used at the site is the Kubota RW400. The modules were installed in 2010 and have not been replaced. The RW400 houses 515 model flat plate membranes (Fig. 4) based on a chlorinated polymer, with an average pore size of 0.2 µm.
Pathogen and indicator microorganism sampling and analysis
Samples for pathogen determination were collected from Lake of the Pines WWTP from April 2019 through June 2021. MBR filtrate samples of 240 L were taken in 2019. Due to continual non-detects, sample volumes were increased to a target of 1,000 L in 2020 and 2021.
Grab samples of raw wastewater were collected following screening and prior to biological treatment. Filtrate Cryptosporidium and Giardia levels were determined following enrichment using an Envirocheck filter; viruses were concentrated using a NanoCeram filter. Grab samples of filtrate were taken for the indicator microorganisms C. perfringens, male-specific and somatic coliphages and total coliforms during pathogenic microorganism sampling. Pathogens and microorganism samples were shipped overnight on ice to Analytical Services, Inc. (Williston, VT) for analysis.
Data analysis
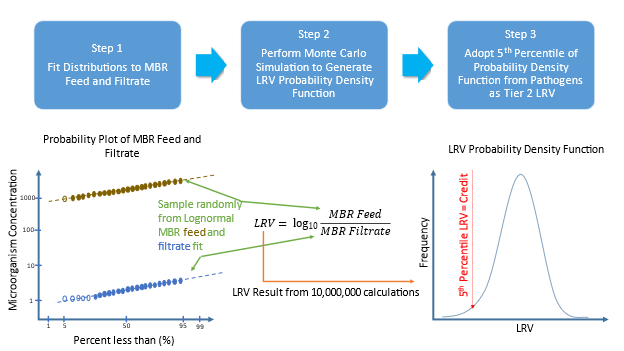
Data fitting was performed in Excel in the same way as that used in WRF4997 (Salveson et al., 2021). A log10 transformation was made of the feed and filtrate data, and standard deviation (SD) values were determined using the slope and intercept from a z-value plot.
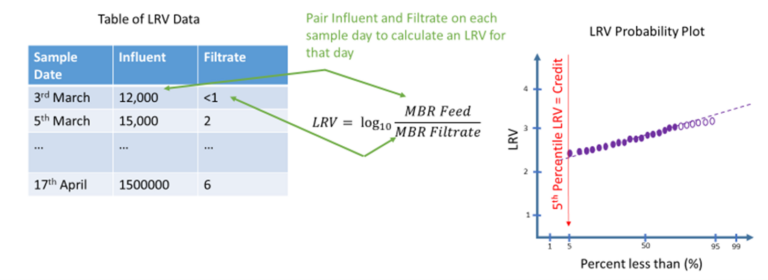
Probability plots were prepared from available data (Fig. 5). Censored data, (i.e. data outside the limits of analytical detection) was substituted to take the numerical value of the limit of detection without censoring. If more than three values were certain data, i.e. not censored, then an additional fit was made to extrapolate through censored data (Fig. 6).
3. Results
Pathogen and indicator data
The number of data points for each organism in the feed, filtrate and available LRV data points from a same-day paired analysis, along with the number of detected values, are summarized in Table 1.

Analysis and interpretation of enteroviruses by reverse transcription-polymerase chain reaction (RT-PCR) was challenging since the data was mostly censored in both the feed and filtrate. RT-PCR analysis was envisaged to be advantageous since it has a shorter turnaround time than culturable virus analysis which typically takes two months. PCR-based analyses have been reported to be more sensitive, detecting organisms that are present but inactivated, resulting in an LRV that could be more conservative than culture-based analysis. However, analytical interferences (i.e., inhibition) to the RT-PCR analysis in the influent and filtrate matrix necessitated dilution of the samples prior to analysis, which in turn reduced sensitivity. The significantly variable detection limits and a high level of censoring meant that most of the enterovirus data analyzed by RT-PCR was uncertain. By contrast, the culture-based analysis of enterovirus yielded more stable results and was reliably detected in the feedwater and a majority of filtrate samples.
Cryptosporidium was detected in the feedwater in 42% of samples and never detected in the filtrate; Cryptosporidium LRVs reported are thus underestimates of true performance. Giardia was reliably detected in all feedwater samples. Additionally, when filtrate sample volumes were increased to 1,000 L, Giardia was observed at detectable levels in the filtrate.
Of the virus indicators, somatic coliphage was more consistently detected in the filtrate than male-specific coliphage, an observation that has been noted in a number of other studies (Branch et al., 2021; Salveson et al., 2021).
Virus and protozoa removal performance
WRF4997 recommends using the 5th percentile LRV to conservatively benchmark performance of an MBR system. The 5th percentile LRVs for virus, protozoa, and surrogate microorganisms are shown for the Monte Carlo calculation (Fig. 7). The mean and SD of the LRV distribution resulting from each calculation method applied to each organism is summarized in Table 2. Cryptosporidium concentrations were censored in the filtrate for all samples; the calculated Cryptosporidium LRVs(1) shown in Table 2 are thus likely to be underestimated.
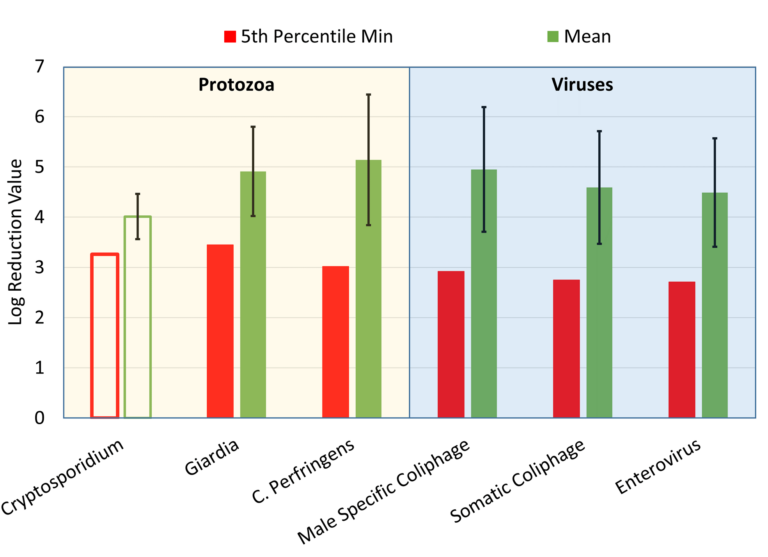

The mean removal of C. perfringens was in very good agreement with Giardia. The higher SD values observed for C. perfringens resulted in a lower 5th percentile LRV. Unfortunately, the Cryptosporidium
results in this work are largely inconclusive and most likely an underestimate of performance. However, based on a 5th percentile LRV of nearly 3.3, the 5th percentile LRV of C. perfringens did correspond to that of Cryptosporidium
(5th percentile LRV of >3.0 to >3.1, depending on calculation method). Ultimately, the results of this suggest C. perfringens to be a reasonable surrogate for Giardia and perhaps a conservative surrogate for Cryptosporidium.
Monte Carlo and same-day paired somatic coliphage 5th percentile LRVs of between 2.7–2.8 were close to the target virus (culturable enterovirus), where the 5th percentile was also 2.7–2.8 cf. male-specific coliphage 5th percentile LRVs between 2.9–3.4. Although close to the target virus, male-specific coliphages may not be as conservative a surrogate for MBR virus removal performance as somatic coliphages. The similar tendency for a higher rejection of male-specific cf. somatic coliphages has been previously reported (Branch et al., 2021; Salveson et al., 2021).
4. Conclusions
An analysis of pathogen rejection is presented for a facility fitted with its original membranes, operated continuously for 10 years without repair or replacement. The 5th percentile LRVs determined provide a conservative estimate of the pathogen removal performance for other similarly well-maintained MBRs equipped with the same Kubota membranes.
The data set collected suggests that the system is achieving at least an LRV >3.0 for protozoa, while the specific LRV for Giardia was demonstrated to be greater than 3.5. Culturable enterovirus removal was significant, typically above a 5th percentile of 2.7 and appeared to be reasonably represented by somatic coliphage removal, where the 5th percentile was also 2.7. These LRVs are significant, given that they relate to a near end-of-life membrane product following the Tier 2 MBR validation protocol recommended as part of WRF4997. The LRVs noted above provide a reasonable conservative estimate of what LRV Tier 2 validation could demonstrate relative to Tier 1: that is, an increase of protozoa and virus LRV by 1 to 1.5 log units over the life of the membrane system. It is anticipated that if newer membranes were tested, pathogen LRV results may be even higher. Cryptosporidium was not detected in the filtrate.
RT-PCR testing of enterovirus was anticipated to provide valuable and rapid results, relative to older culturable techniques. However, the technique performed poorly compared with conventional methods, possibly requiring further method development.


