Cost comparison of full-scale water reclamation technologies with an emphasis on membrane bioreactors

Raquel Iglesiasa, Pedro Simónb, Lucas Moragasc, Augusto Arced, Ignasi Rodriguez-Rodae
aDepartment of Water Technology, Centre of Hydrography Studies (CEDEX), Spain
bEntidad de Saneamiento y Depuraciónde Aguas Residuales de la Région de Murcia (ESAMUR), Murcia, Spain
cAgencia Catalana Del Agua (ACA), Barcelona, Spain
dDepartment of Chemistry and Food Processing, Technical Agriculture Engineering of Universidad Politécnica de Madrid (UPM), Madrid, Spain
eCatalan Institute for Water Research (ICRA), Girona, Spain; Laboratory of Chemical and Environmental Engineering (LEQUiA), Girona, Spain
1. Introduction
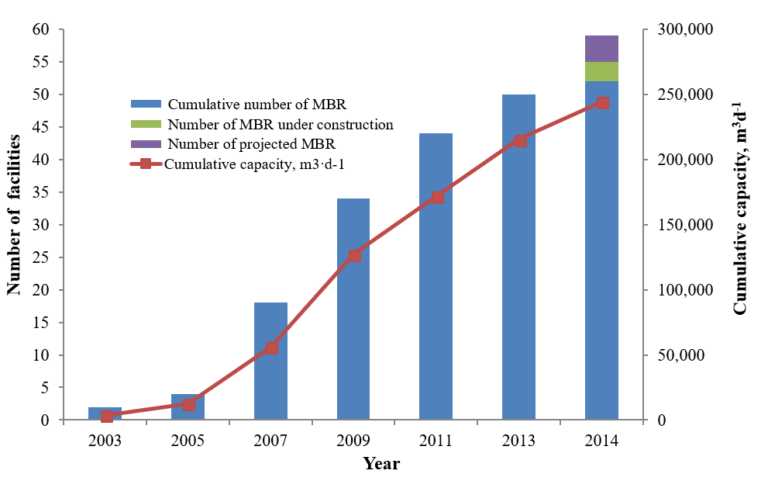
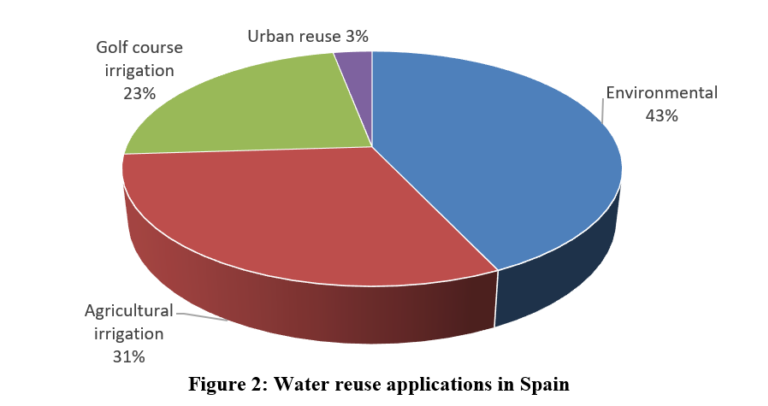
MBR installation in Spain began in 2002, increasing from four 400−6,000 m3d-1 facilities by 2005 to more than 50, with a total capacity of ~244,000 m3d-1, by 2014 (Fig. 1). As such, the country has an unusually large number of MBRs compared with other EU nations, in part associated with its commitment to water reuse (Fig. 2). Elsewhere in Europe, water reclamation is typically for agriculture or indirect potable reuse such as aquifer injection or surface water discharge.
Despite the well-known advantages offered by MBRs, specifically the high treated water quality coupled with the small footprint, the costs associated with the technology are not as well documented.
It is therefore useful to consider cost information available from the installations across Spain, and to compare this with corresponding information for the more conventional activated sludge (CAS) technologies. The CAPEX and OPEX − capital and operating expenditure − information is used to generate cost curves as a function of flow capacity or population equivalent (p.e.) for both technology types.
2. Methodology
The 14 installations considered (Table 1) were all of the immersed process configuration (iMBR) based on the Suez ZeeWeed (hollow fiber, HF) or the Kubota (flat sheet, FS) membrane. These installations are reasonably representative of those employed for water reuse in Spain. The information was provided by public wastewater management institutions in Catalonia and Murcia (ACA and ESAMUR).
| MBR | Code | Capacity (m3d-1) | Pretreatment | System type | Membrane configuration | Start-up |
|---|---|---|---|---|---|---|
HF: hollow fiber | ||||||
| Aledo | AL | 288 | S | MBR | FS | 2008 |
| Calasparra | CL | 2,000 | PC+S | H (MBR−CAS) | HF | 2006 |
| El Valle | EV | 1,400 | S | MBR | FS | 2007 |
| La Bisbal | LB | 3,225 | PC+S | H (MBR−CAS) | HF | 2003 |
| Los Cañares | LC | 3,750 | S | MBR | FS | 2008 |
| Mar Menor | MM | 1,880 | S | MBR | FS | 2009 |
| Riquelme | RQ | 1,575 | S | MBR | FS | 2007 |
| Riells Viabrea | RV | 2,116 | S | H (MBR−CAS) | FS | 2004 |
| Sabadell | SB | 35,000 | PC+S | H (MBR−CAS) | FS | 2008 |
| San Pedro | SP | 20,000 | S | MBR | HF | 2007 |
| Terrassa | TR | 15,000 | PC+S | D (MBR−IF) | HF | 2008 |
| Vacarisses | VC | 1,320 | S | MBR | HF | 2010 |
| Viladecans | VD | 32,000 | PC+S | D (MBR−IF) | HF | 2010 |
| Vallvidrera | VV | 1,100 | S | MBR | HF | 2008 |
Available data were used to determine CAPEX (in € per m3d-1 capacity and per p.e.) and OPEX (€ per m3 produced or € per kg of BOD removed). Six MBR facilities were selected for the CAPEX study:
- EV, MM, RQ, SP, VC and VV,
and 11 selected for OPEX:
- AL, CL, EV, LB, LL, MM, RQ, SP, VC and VV.
CAPEX calculations ignored local variations in land, equipment and materials costs; investment costs were obtained from the liquidation budget and excluded overheads and profit. VAT was excluded from all costs, and start-up assistance for 3−6 months assumed. Costs were updated to 31/12/2011 for data published between 2002 and 2009, using the CPI (Consumer Price Index) to adjust costs to the baseline date.
In some cases, the MBR was retrofitted to an existing CAS process by placing the membranes in either the secondary clarifier or within the biological tank. These facilities were excluded from the analysis for determining cost curves, though implementation costs were logged.
OPEX is significantly impacted by optimization, and specifically (a) the period of time over which the installation operates at full capacity, and (b) the membrane air scour management strategies during under-capacity periods. Some installations (e.g. LB) divert the feed to the secondary clarifier when the MBR capacity is exceeded. In 2011, this plant treated no more than 30% of the total flow capacity from the conventional treatment line: the OPEX data for this line was therefore excluded from the analysis of total OPEX for this plant.
Key OPEX components (Table 2) were broken down into fixed (A) and variable costs (B), with global energy use normalized against permeate flow (kWh per m3) and load (kWh per kg BOD) with energy costs ranging from €0.096 to €0.121 per kWh. Although membrane replacement was excluded, an average membrane life of 10 years would be expected to add 10−12% to the OPEX.
Other OPEX contributors include sludge management, waste disposal, chemical prices, and management by private or public entities. The latter can subcontract services with different agreement conditions. Sludge disposal contributed between 20% and 30% to the OPEX. Average costs per ton of wet sludge were €15−20 for agricultural use, €30−35 for composting, and €40−60 for thermal drying.
| Costs | Items included |
|---|---|
| A. Fixed costs, € year-1 | |
| Operators | Annual salary/maintenance engineer |
| General expenses | Accounting, fees, insurance, supplies |
| Maintenance and repairs | Equipment and infrastructure |
| Energy | Potential term (€ kW-1 year-1) |
| Chemical analysis | Royal Decree 11/1995 |
| B. Variable costs, € year-1 | |
| Overall energy consumption | Pre-treatment, membrane, biological and sludge |
| Waste and sludge | Disposal management |
| Chemicals & replaceable components | Membranes |
CAPEX is influenced both by the required effluent quality and the footprint. The land area required by the MBRs studied ranged from 0.15 to 0.30 m2 per p.e.
The MBR facilities data were compared with those from 75 CAS installations constructed between 1993 and 2007 based on conventional water reclamation treatment (CRT, coagulation followed by sand filtration and disinfection), and advanced water reclamation treatment (ART, with membrane polishing). Capacities of these WWTPs range from 2,000 to 48,000 p.e., or 360 to 12,300 m3d-1. All facilities operated under extended aeration (EA), and many included biological nitrogen removal. The CAPEX and OPEX for ART and CRT were obtained from published data and converted to €.m-3 treated water for OPEX and € per m3.d-1 installed capacity for CAPEX. The values were added to the EA costs as mean values of the range of each type of treatment.
In addition, new OPEX and CAPEX data for EA, CRT and ART were gathered from CYII, ACA and ESAMUR facilities in 2015, comprising 35 CAS−EA, 16 CRT and 5 ART facilities having flow capacities of 5,000−10,000 m3d-1. All cost data were normalized to the same date of December 31, 2011.
3. Results and discussion
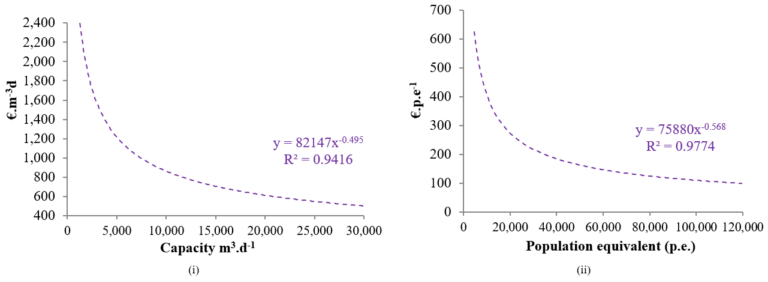
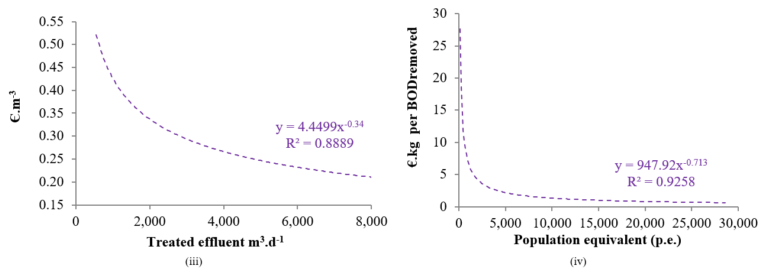
Investment costs (Table 3), excluding retrofits and dual installations, ranged from 2,000 to 3,200 €.m-3.d and 420−650 €.p.e.-1 for facilities with capacities of 1,000−2,000 m3d-1. For capacities exceeding 10,000 m3d-1 the cost decreased to as low as 625 €.m-3.d and 94 € p.e.-1 (Fig. 3).
A comparable range of OPEX can be established by considering the six plants operating regularly in 2011 (Table 4), including the specific aeration demand (SAD) for air-scouring the membrane. SAD can be expressed in terms of the air flow per m2 membrane area (SADm) or per m3 permeate (SADp). According to these data, the FS configuration has SADm values predominantly in the 0.45−0.5 m3h-1m-2 range, compared with 0.26−0.3 for the HF modules.
| MBR |
Capacity m3.d-1 | Capacity p.e. |
Type of process(1) | Configuration |
Membrane area m2(2) |
Cost €.m-3.d |
Cost €.p.e-1 |
|---|---|---|---|---|---|---|---|
(1)N−D+P: biological nitrogen removal with chemical precipitation of phosphorus. EA−N−D: Extended aeration with biological nitrogen removal. | |||||||
| EV | 1,400 | 4,666 | EA-N-D | FS | 2,560 | 1,982 | 595 |
| MM | 1,880 | 7,800 | EA-N-D | FS | 3,200 | 2,002 | 482 |
| RQ | 1,575 | 5,250 | EA-N-D | FS | 3,200 | 2,074 | 622 |
| SP | 20,000 | 133,333 | EA-N-D | HF | 48,537 | 625 | 94 |
| VC | 1,320 | 6,600 | N-D+P | HF | 3,030 | 2,130 | 426 |
| VV | 1,100 | 5,500 | N-D+P | HF | 2,526 | 3,277 | 655 |
| AL | CL | MM | RV | SP | VV | |
|---|---|---|---|---|---|---|
Fd: Design flow | ||||||
| Biological system | ||||||
| Fd/Ft (%) | 36 | 89 | 21−37 | 51 | 41 | 77 |
| SRT (days) | 52 | 38 | 40−80 | 13 | 43 | 16 |
| MLSSb | 10,000 | 5,429 | 9,000 | 8,900 | 3,250 | 7,298 |
| HRT (h) | 60 | 24 | 25−12 | 12 | 24 | 15 |
| SP(kg MS.kg BOD−1 ) | 0.99 | 0.60 | 0.49−0.75 | 0.81 | 0.89 | 1.12 |
| Membrane system | ||||||
| Configuration | FS | HF | FS | FS | HF | HF |
| T (ºC) | 22 | 22 | 24 | 19.5 | 22 | 18 |
| LMHm (L.m−2.h) | 25 | 17.5 | 25 | 10.5 | 14−25 | 28 |
| LMHp (L.m−2.h) | 42 | 33 | 49 | 27.2 | 41 | 30,9 |
| TMP (mbar) | −65 | −155 | −120 | −250 | −120 | −110 |
| K (L.m−2.h−1.bar−1) | 385 | 112 | 250 | 42 | 206 | 294 |
| MLSSm (mg.L−1) | 12,000 | 6,000 | 11,000 | 13,500 | 6,000 | 7,298 |
| R (n x Ft) | 4 | 4 | 0.9 | 1.4 | 3 | 3 |
| Cycle (F−B−R; F−B−F−R) (min.) | 9−0−1 | 10−0,5 | 9−0−1 | 9−0−1 | 17−1−1 | 10−0,5−10−0,5 |
| SADm (Nm3.h−1.m−2) | 0.8 | 0.3 | 0.45 | 0.51 | 0.26 | 0.27 |
| SADp (Nm3.m−3) | 45 | 24.32 | 31 | 24.18 | 18.3 | 19.27 |
The energy consumption significantly increases for biological tank mixed liquor suspended solids (MLSS) above 6 g.L-1 due to the decreased oxygen transfer coefficient and increased recirculation rate required to maintain a low of suspended solids concentration in the membrane tank. Low MLSS concentrations, and the associated low energy demands, are possible for oversized facilities providing flexibility in operation, in terms of the number of lines, decks and blowers, as well as the membrane configuration. The SP and RV facilities have such flexibility.
The specific OPEX in plants treating >50% of their flow capacity was between 0.2 and 0.5 €.m-3 at a BOD concentration of 150−600 mg.L-1, and €0.5−18 per kg BOD removed depending on the load (in kg BOD.day-1) and flow (Table 5). OPEX indicators across the selected installations were highly variable due to the non-optimal flows and/or loads of the WWTPs and the differing plant capacities, waste sludge disposal options and costs, and the financial and contractual arrangements at each site. Subsidies are sometimes provided from the reuse of the treated water and waste sludge, which then impacts on the OPEX since the volume of sludge generated can be altered through adjusting the operating conditions.
| Site | Capacity m3.d−1 | Treated m3.d−1 | Specific cost €.m−3 | Specific cost €.kgBOD−1 | Sludge treatment(1) |
|---|---|---|---|---|---|
(1)Sludge disposal costs are included in OPEX | |||||
| AL | 288 | 104 | 2.590 | 4.3 | AGR |
| CL | 2,000 | 1,793 | 0.330 | 0.5 | COM |
| EV | 1,400 | 219 | 1.600 | 44 | AGR |
| LB | 3,225 | 4,626(2) | 0.215 | 0.8 | COM−TD |
| LC | 3,750 | 161 | 2.180 | 17 | AGR |
| MM | 1,880 | 552 | 0.480 | 3.8 | AGR |
| RQ | 1,575 | 362 | 0.970 | 18 | AGR |
| RV | 2,116 | 1,116 | 0.397 | 3.2 | COM |
| SP | 20,000 | 8,247 | 0.241 | 1.5 | AGR |
| VC | 1,320 | 683 | 0.577 | 4.9 | COM |
| VV | 1,100 | 849 | 0.460 | 2.9 | COM |
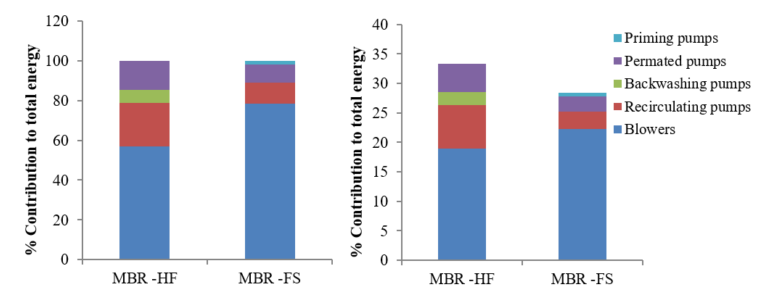
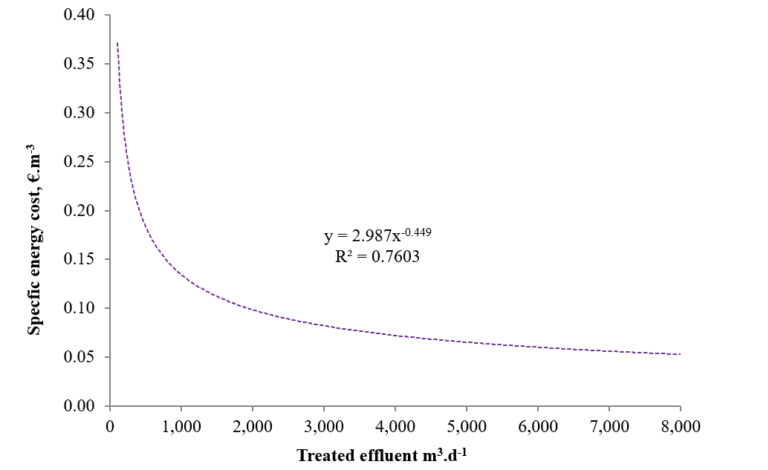
Energy consumption was similarly variable (Table 6), and mainly associated with aeration (Fig. 4). The blowers contributed 19−22% to the total energy consumed on site, the energy demanded by the MBR representing 28−34% of the site total energy consumption and accounting for 41% of the total OPEX on average. The specific energy consumption was in the range 0.6−1.2 kWh.m-3 for facilities treating >50% of their flow capacity with regular feed water quality. At an average energy cost of €0.11 kWh-1, OPEX attributable to energy consumption ranged from 0.06 to 0.13 €.m-3 in facilities treating more than 2,000 m3.d-1 (Fig. 5).
| MBR | kWh.m−3 WWTP(1) | kWh.m−3 MBR(2) | €.kWh−1 WWTP | €.m−3 WWTP | % MBR |
|---|---|---|---|---|---|
(1) Overall WWTP energy consumption | |||||
| AL | 3.27 | 1.710 | 0.118 | 0.387 | 52.29 |
| CL | 0.98 | 0.898 | 0.096 | 0.100 | 85.85 |
| EV | 2.60 | 0.860 | 0.108 | 0.420 | 33.05 |
| LB | 0.550 | 0.190 | 0.115 | 0.063 | 34.55 |
| LC | 2.51 | 1.950 | 0.097 | 0.340 | 77.69 |
| MM | 1.27 | 0.790 | 0.117 | 0.111 | 83.16 |
| RQ | 1.63 | 0.900 | 0.110 | 0.180 | 55.21 |
| RV | 0.680 | 0.460 | 0.105 | 0.071 | 67.65 |
| SP | 0.75 | 0.534 | 0.104 | 0.079 | 69.99 |
| VC | 2.00 | 1.10 | 0.121 | 0.241 | 55.00 |
| VV | 1.097 | 0.714 | 0.118 | 0.129 | 65.09 |
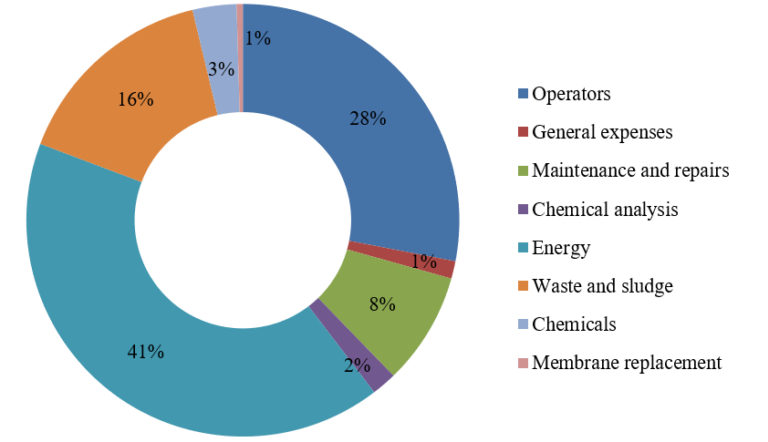
Overall, waste and sludge disposal contributed an average of 16% to the OPEX for the installations studied (Fig. 6). Chemical costs for membrane cleaning were around 3% of the OPEX. Membrane replacement costs do not feature in this study: there had been no membrane replacement in the 5−8 years of operation of the installations. Replacement at two of the facilities was attributable to design flaws rather than degradation of the membrane through routine operation. However, for a membrane life of 8−10 years, membrane replacement contribution to OPEX can be assumed be €0.02−0.04 m-3.
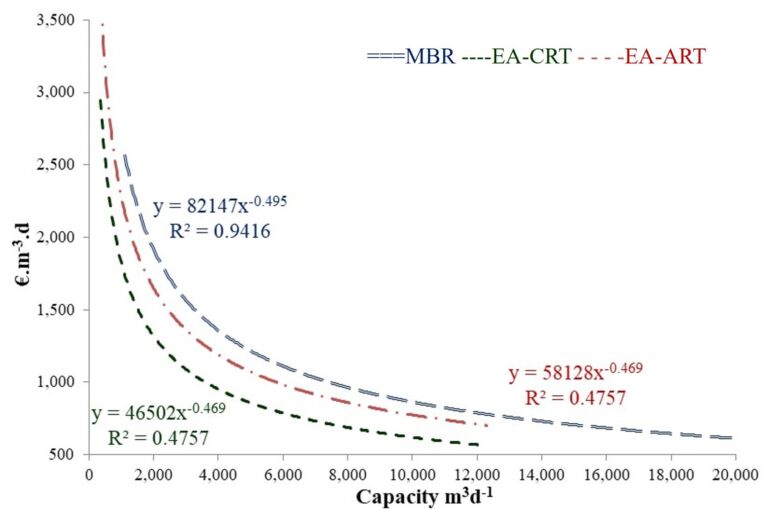
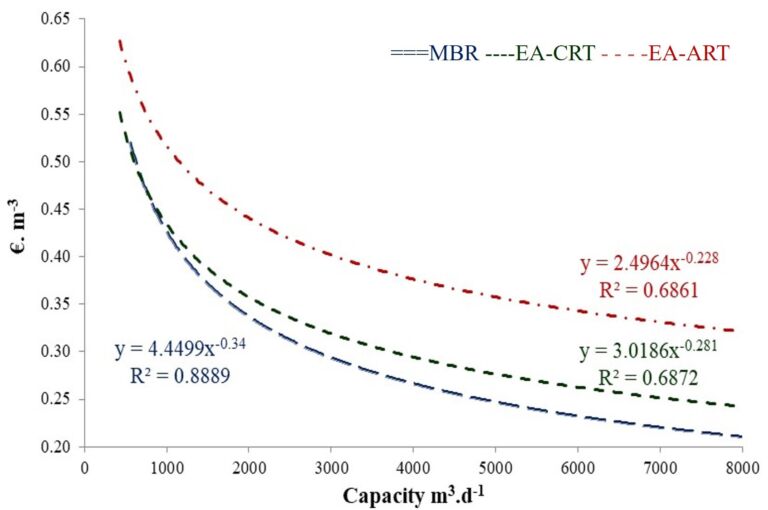
A comparison of the MBR system costs with those for EA(ND) (extended aeration with nitrification/denitrification), with ART (physical−chemical treatment with a lamella settling system, depth filtration, ultrafiltration and disinfection) and CRT (physical−chemical treatment with a lamella settling system, depth filtration and disinfection) indicates significant differences (Fig. 7). The CAPEX for EA(ND)−CRT ranged from €730−850 per m3.d-1 flow for plants having installed capacities of 8,000−15,000 m3.d-1. The costs were between €1,250 and €1,050 per m3.d-1 if followed by ART and between 700 and 960 €.m-3.d for MBR treatment.
Membrane filtration costs are compensated by savings in civil construction compared to CAS with water reclamation treatment. However, this differs for capacities over 8,000 m3d-1 for retrofitting with ART and for capacities over 15,000 m3d-1 for retrofitting with CRT. Membrane system investment costs are decreasing, so the cost effectiveness of MBR is expected to improve in the future. Moreover, MBR footprint is 40−60% lower than that of classical treatment technologies, reducing land costs.
The OPEX of the studied MBR ranging from €0.2 to €0.45 per m3 treated, and the costs of BOD removal from €0.5 to €4.5 per kg BOD removed. An MBR facility, when operating in conjunction with EA(ND), can achieve a specific energy consumption of ~1 kWh.m-3 if based on a flexible design and operated close to its capacity at a low MLSS. The MBR has a similar energy consumption to the CAS−ART compared to CAS with water reclamation technologies and is 20% higher than CAS−CRT (Table 7).
| Type of WWTP | Energy consumption (kWh.m−3) | Energy cost(1) (€.m−3) |
|---|---|---|
(1)at €0.11 kWh-1 | ||
| MBR (EA-N-D) | 0.8−1.2 | 0.06−0.11 |
| CAS (EA-N-D) | 0.4−0.8 | 0.04−0.08 |
| CAS (EA-N-D)+ CRT | 0.6−1.0 | 0.06−0.1 |
| CAS (EA-N-D) +ART | 1−1.2 | 0.1−0.12 |
The CAPEX for the 16 CRT-based facilities considered was around €115 per m3d-1 at capacities of 5,000−10,000 m3.d-1 compared with €100 per m3.d-1 for facilities with a capacity of 20,000 m3.d-1. Data from five facilities provided by Spanish local water agencies ACA and CYII indicated the ARTs to have an average CAPEX of €430 per m3d-1 for facilities with capacities of 5,000−10,000 m3.d-1. A comparative CAPEX exercise performed for EA−CRT, EA−ART and MBR in facilities in this range of flow capacities, based on 13 of the WWTPs operating with EA, indicated an average investment cost of €600 per m3d-1, giving an average CAPEX of 715, 1,030 and 960 €.m-3d for EA−CRT, EA−CRT and MBR respectively.
The OPEX for reclaimed water was approximately €0.08−0.12 and €0.18 per m3 for CRT and ART-based facilities respectively, excluding conveyance to the reuse zone (€0.02 to €0.04 per m3 transported). The average OPEX for the 22 EA facilities studied with capacities of 5,000−10,000 m3d-1 was 0.22 €.m-3 (including sludge disposal management), giving a mean average total OPEX of 0.31, 0.4 and 0.32 €.m-3 for the EA−CRT, EA−ART and MBR technologies respectively.
4. Conclusions
An analysis of the projected and real data for the CAPEX and OPEX of 14 MBRs with capacities of 288−35,000 m3d-1 based on HF and FS membrane configurations has provided cost curves for both CAPEX and OPEX. Data were supported through comparison with similar data from other WWTPs and water reclamation technologies providing identical or similar water quality.
The CAPEX of the MBR technology was found to be around 10% lower than that of a reuse installation based on conventional extended aeration with tertiary membrane polishing. MBR costs were, however, 30−34% higher than those associated with classical tertiary clarification by coagulation followed by sand media filtration and disinfection at capacities below 10,000 m3.d-1.
The cost benefits of MBRs increase with increasing plant size due to the decreased labour requirement, though the energy demand is higher than for conventional processes.


