MBRs: the Chinese experience

Kang Xiao1,2, Shuai Liang1,3, Xiaomao Wang1, Chunsheng Chen1, Xia Huang*,1
1State Key Joint Laboratory of Environment Simulation and Pollution Control, THU-Beijing Origin Water Joint Research Center for Environmental Membrane Technology, School of Environment, Tsinghua University, Beijing 100084, China
2College of Resources and Environment, University of Chinese Academy of Sciences, Beijing 100049, China
3College of Environmental Science and Engineering, Beijing Forestry University, Beijing 100083, China
1. Introduction
A feature of the MBR market over the past decade is the surge in the number of very large (≥100 MLD, or megalitres/day) installations, particularly in China. Of the 55 known global installations of greater than 100 MLD capacity, 39 are in China. The Chinese plants account for 74% of the total capacity of this group. Moreover, all of the 55 plants have been installed within the past 11 years, starting with the commissioning of the Wenyu River plant near Beijing in October 2007 which followed the installation of the 36 MLD Beijing Miyun plant the year before.
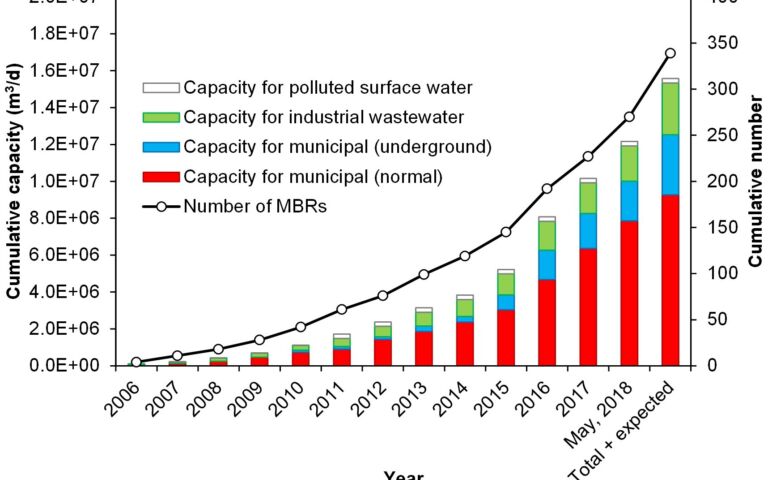
An examination of the ≥10 MLD Chinese plants (Fig. 1) reveals that the cumulative capacity of these large-scale MBRs in China had reached 1,000 MLD (or 1 GLD, gigalitres/day) by 2010 and 10 GLD by 2017, three quarters of them being for municipal applications. If plants currently under construction are taken into account, the figure is closer to 15 GLD. This rapid expansion seems to corroborate frequently published CAGR (compound annual growth rate) figures of 20−25% for the Chinese MBR market − despite the technology accounting for only around 5% of China’s overall municipal wastewater capacity of 178 GLD (as of May 2018). And the civil engineering involved for some of these plants is considerable: 25 of the large-scale MBR plants in China are underground, such as Guangzhou Jingxi and Kunming, providing a combined capacity of 2 GLD. There are also at least two industrial effluent treatment MBR plants of 200 MLD or more peak flow capacity.
2. Capital costs
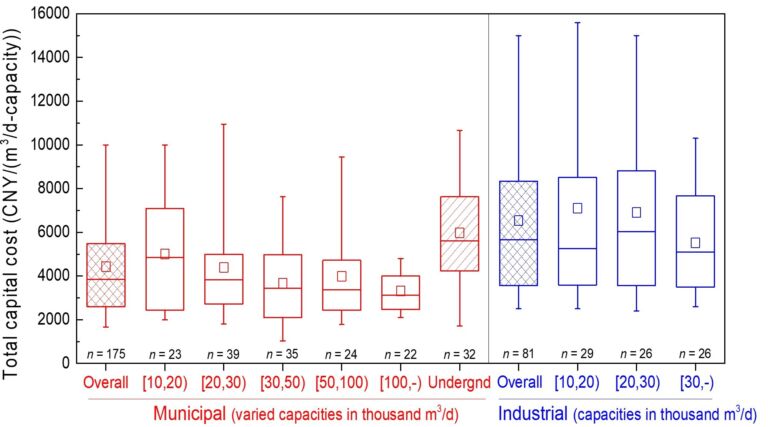
A typical breakdown of MBR component construction costs for the >10 MLD plants in China is ~40% for the tanks, ~10% for the pipes and channels and ~20% for the membrane modules, the remaining equipment making up 30%. Preliminary/primary treatment, biological/membrane treatment (i.e. the core MBR process), advanced treatment, and sludge treatment units respectively account for 10−20%, 55−85%, 0−30%, and 5−10% of the plant construction cost. For municipal wastewater treatment, the MBR specific capital cost (sCAPEX) is mainly in the range of ~380−800 USD/(m3/d) with an average of ~600 USD/(m3/d) (Fig. 2). This compares with an average of ~380 USD/(m3/d) across all municipal wastewater treatment plants in China, which generally exclude tertiary treatment required to achieve a comparable water quality to that attained by an MBR.
As is to be expected, the sCAPEX decreases with increasing plant size, and both the underground municipal MBRs and the industrial MBRs incur a higher sCAPEX than the above-ground municipal plants. Underground MBRs incur high civil engineering costs, while industrial MBRs (sCAPEX of ~600−1,200 USD/(m3/d)), ~900 USD/(m3/d) on average) generally operate at longer residence times and lower fluxes − hence demanding larger tanks and greater membrane areas.
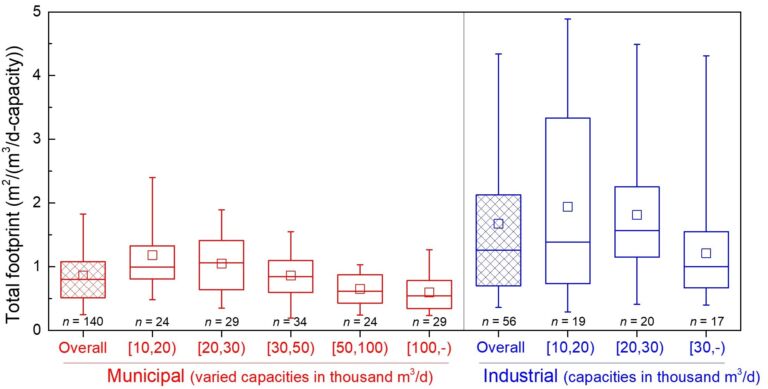
The total plant specific footprint, including that of the tanks, buildings, roads and green areas, is mainly in the range of 0.5−1.2 m2/(m3/d), ~ 0.8 m2/(m3/d) on average for the municipal MBRs (Fig. 3). This compares with the corresponding figure for a Chinese conventional activated sludge (CAS) based municipal plant (10−50 MLD capacity) of 0.85−1.2 m2/(m3/d) without and 1.2−1.6 m2/(m3/d) with tertiary treatment. For industrial MBRs, the figures are 0.7−2.2 m2/(m3/d) and 1.5 m2/(m3/d) on average, the larger footprint associated mainly with the larger tanks − as also reflected in the sCAPEX. Analogous to the trend in sCAPEX, the specific footprint decreases with increasing plant capacity.
3. Operating costs and energy consumption
The breakdown for operational expenditure (OPEX) is around 40−60% energy consumption, 10−30% chemical consumption, 5−15% sludge disposal, 10−30% labour and 5−20% for the remainder, ignoring membrane depreciation. Membrane depreciation/replacement can be calculated at 0.015−0.045 USD/m3 for a hollow fibre (HF) membrane cost of 22−30 USD/m2, effective flux − accounting for slack flow periods − of 14−20 L/(m2 h) (LMH), and a 5−10 y lifespan. The OPEX depends on treatment capacity, with larger capacity corresponding to narrower distribution of operating cost (Fig. 4a). Overall, the operating cost (not including membrane depreciation) is mainly in the range ~0.12−0.2 USD/m3 for MBRs commissioned in 2006−2014, and 0.11−0.18 USD/m3 for MBRs commissioned thereafter (Fig. 4b). As with sCAPEX, this is somewhat higher than the mean OPEX of ~0.11 USD/m3 for all municipal wastewater treatment plants in China where tertiary treatment is excluded.
Energy is consumed primarily by aeration (membrane scouring and biological process), liquid pumping, and mixing, with aeration consuming the most energy. The overall energy consumption is in the range 0.45−0.8 (with a median of 0.55) kWh/m3 for MBRs of <50,000 m3/d, and 0.4−0.6 (with a median of 0.5) kWh/m3 for capacities of 50,000 m3/d and above (Fig. 4a). Energy consumption has decreased for the more recent installations, from 0.5−0.7 (with a median of 0.6) kWh/m3 for MBRs commissioned in 2006−2014 to 0.35−0.65 (median of 0.4) kWh/m3 for those commissioned thereafter (Fig. 4b). This possibly reflects improved design and operational practices, especially for the aeration systems where optimisation has taken place for both the process air (primarily through improved control) and membrane air scour through design technological advancements. The energy consumption of these MBRs is therefore approaching that of the CAS process (again, without tertiary treatment) of 0.2−0.6 kWh/m3.
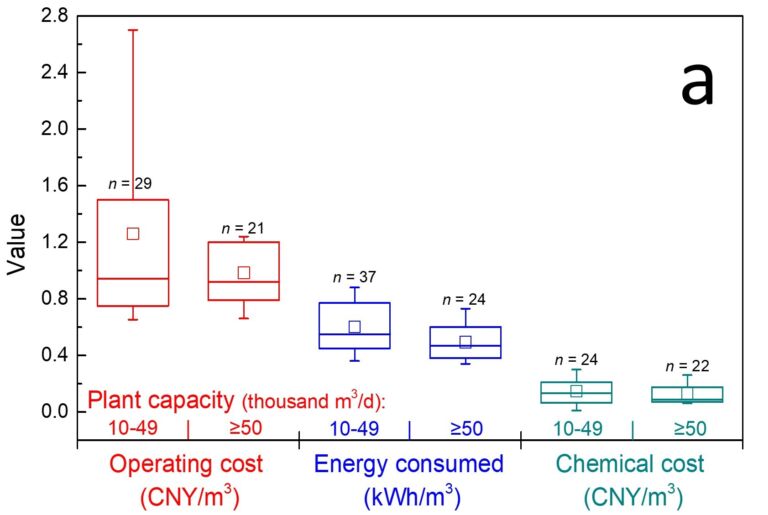
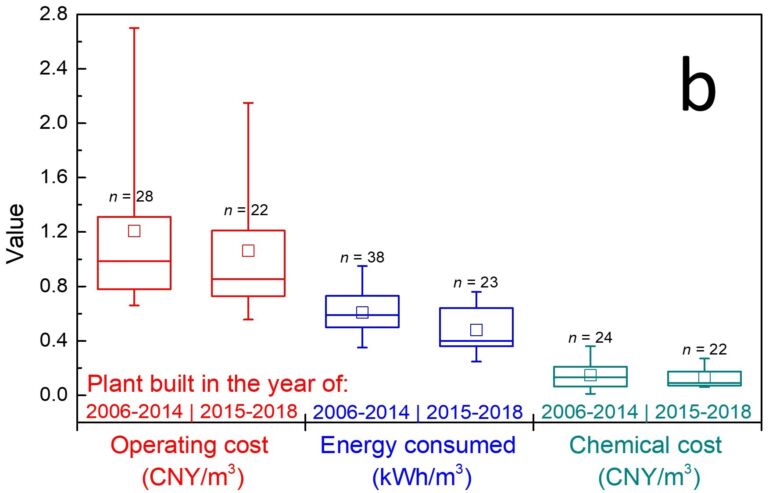
The chemical cost is mainly in the range ~0.015−0.04 USD/(m3/d), from external carbon source addition (where required), phosphorus removal using coagulants, chemical disinfection and sludge conditioning. MBRs specifically require chemicals for membrane chemical cleaning and, in some cases, mixed liquor conditioning. So, while these chemical costs are modest, they are nonetheless higher than those associated with CAS.
For sludge treatment and disposal, the excess sludge from the MBR is mechanically dewatered (e.g., via recessed-plate filter press) after chemical conditioning and is then finally disposed of, in most cases in China, by landfill or incineration. In a few more recent cases, it is reused as fertilizer, providing a small cost benefit.
4. Operational stability
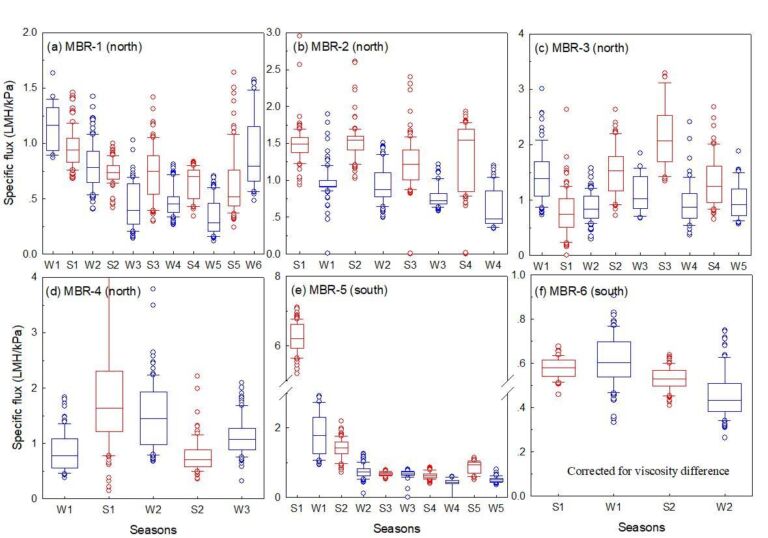
The operational stability can be defined by the steady-state specific flux (or permeability) in LMH/kPa or LMH/bar. Mean permeabilities of six large-scale MBRs located either in northern China (Beijing Municipality) or in southern China (Jiangsu Province) varied widely between sites (Fig. 5) from below 0.5 LMH/kPa (50 LMH/bar) to above 1.5 (150 LMH/bar). Values were higher in the summer (Fig. 5a−e), though correcting for viscosity (Fig. 5f) equalised the values to a significant extent.
A survey of 19 >10 MLD capacity MBR plants showed fluxes to be primarily in the range 15−25 LMH with a median of 19.6 LMH. This flux implies transmembrane pressures (TMPs) of 13−39 kPa for specific fluxes of 0.5 to 1.5 LMH/kPa, below the maximum TMP value of 50 kPa stipulated by most membrane manufacturers. The permeabilities are somewhat lower than expected, suggesting more rigorous operational control and membrane cleaning is required for these installations to reduce costs. Cost reductions arise since, while higher operating pressures have negligible impact on OPEX, improvement of the net flux reduces both the membrane area requirement (and so the CAPEX) and the operating energy through a reduced air scour-to-permeate ratio. The actual measures taken for fouling control particularly in winter, when permeabilities are lower, include (a) adjustment of the sludge concentration through wasting, and (b) increasing the membrane scouring rate, backwash frequency and on-line chemical cleaning frequency. An increased cleaning frequency can require adjusting the sodium hypochlorite solution to a lower concentration to maintain the same chemical mass loading rate. Conditioning of the mixed liquor with coagulants to improve filterability has also been employed at some sites.
5. Water quality, global perspective
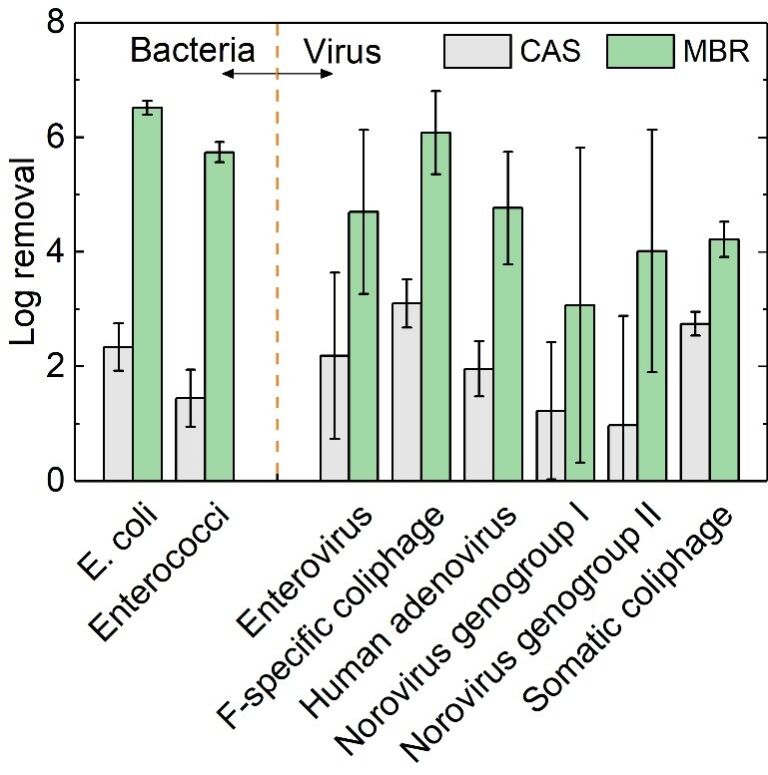
A review of published data relating to the removal of the key water quality determinants of COD, ammonia, total nitrogen (TN) and total phosphorus (TP) reveals COD and ammonia removal to be predominantly above 95% (Fig. 6). TP removal is mostly above 90% and TN above 80%. It is the increasingly stringent global discharge water quality standards − particularly for the nutrients TN and TP − that is underpinning the acceleration of MBR implementation in preference to CAS technology. Furthermore, the MBRs offer considerably improved microbial rejection over CAS (Fig. 7), particularly for the pathogenic bacteria where on average removal achieved is 10,000 greater for MBRs than for the CAS technology.

6. Summary
The implementation of MBRs both globally and within China is likely to grow in the future due to the reliably high treated water quality produced, as demanded by discharge to environmentally sensitive areas and water reuse. Although the CAPEX and OPEX of MBR plants in China are higher than those of a CAS process, the difference in costs has been narrowing over the years. It is evident that improvements in the operational stability of MBRs in China, and specifically improving the steady-state membrane permeability through reliably effective cleaning, may help to narrow the cost difference further. However, associated cost indicators tend to be positive. The cost and/or projected life of commercially-available membranes continue to improve, as does the membrane air scour efficiency (as quantified as the volume of scouring air needed per volume of permeate water produced) through technological advances in membrane module design.


