How much does an MBR cost? The relative cost of an MBR vs an SBR

Sue Lawrence and Russell Reed
Sue Lawrence, Public Works Department, City of La Center, and Russell Reed, Ovivo write that operational experience at La Center WWTP in Washington, USA indicates the cost of MBR technology may be lower than that of a conventional biological treatment process, despite the higher energy demand
1. About La Center
La Center is a small city in Clark County, Washington, USA, with a population of 3,100. The wastewater treatment works at the town was originally constructed in 1967, based on a conventional activated sludge process. It has since been upgraded nine times, including an upgrade to a sequencing batch reactor (SBR) in 2004.
The plant footprint is around 0.75 acres (Fig. 1), with limited room for expansion on the site. It is bordered on all sides, to the north by a commercial area, to the west by a bridge which is the entrance to the City, to the south by a wetlands area and to the east by a public park and amphitheatre.
The membrane bioreactor (MBR) plant was designed based on an anticipated 8.7% annual growth rate over a 20-year period, with reliability and flexibility being of key importance to the design. Three phases were planned for the installation (Table 1): two complete phases for the MBR and one to increase the capacity of the solids treatment and disposal. The total CAPEX for the plant was determined as being around $25m having a peak day capacity of 4.2 MGD (15.9 MLD).
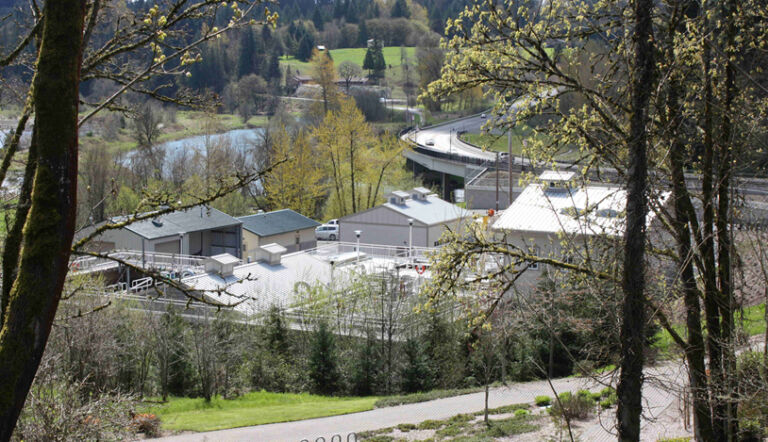

The City wanted to be efficient with the design costs associated with the plant. In order to provide a single design for an MBR system, the City worked with the planning and design engineers, Kennedy/Jenks Consultants, in pre-selecting the membrane supplier prior to completing the design of the facility. This then avoided unnecessary modifications and iterations in the design. Enviroquip (now Ovivo) and the Kubota flat plate membranes were selected.
2. Plant design and modifications
The current MBR plant comprises two process trains with four membrane tanks. Two of the membrane tanks were left empty (Phase 1A) because the flow into the wastewater plant did not require the installation of membranes in all four of the tanks at the current flows. In the event of an increase in flow the City can add membranes into the empty membrane tanks (Phase 1B).
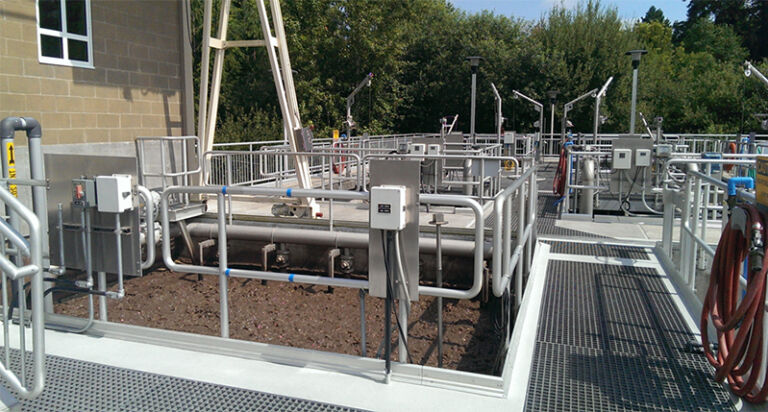
Each train comprises an anoxic, swing, aerobic and membrane tank (Fig. 2), with downstream disinfection. The solids are wasted into an aerated storage basin and then transferred to a day tank prior to dewatering and drying to a Class A EQ biosolid product. The filtrate from the press and cooling water from the dryer exhaust are recycled back into the process basins. Two 3 mm-rated rotary drum screens were installed upstream of the MBRs, each having a rated capacity of 6 MGD.
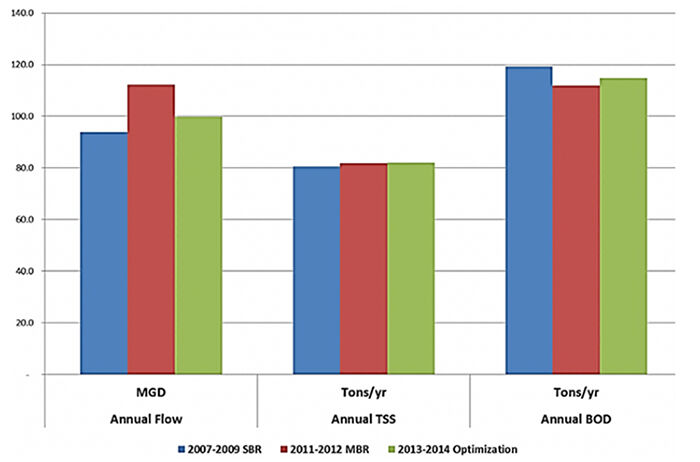
The replacement of the SBR with an MBR, which began operation in 2011, allows a direct comparison of the two plants. Both processes received very similar flows and loads (Fig. 3) for the periods of time over which the data was collected. The SBR was started in 2004, so it was less than 3 years old at the time at which the data collection commenced.
The projected growth dropped from 8.7% to less than 1%, partly as the construction of the Casino Resort (0.5 MGD) was delayed. The City requested a 10% reduction in expenditure as a consequence of the decreased growth. This was particularly challenging for the plant since the programming for the process control was not flexible and the volume of the system could not be decreased to accommodate the reduced flow.
The plant was built to be energy efficient, with gravity flow into the plant from raised headworks and pump-assisted gravity for permeation. Because the plant was a retrofit it was not possible to take one process train completely offline without removing one MBR basin. Therefore only one MBR could be run during average flows, with higher flows demanding both basins.
In order to make the system efficient it was necessary to modify the plant to allow operation of only one MBR at a time. The basic programming for this would allow two different operational modes: continuous and semi-batch. Continuous operation was based on averaging the flow coming in and matching the permeate flows to this mean flow. For semi-batch operation, the tanks were allowed to fill and then permeate extracted until the hydrostatic head had reduced to a set-point through permeation.
To minimise the time both basins were permeating, the available equalisation volume had to be harnessed so as to keep the basins offline until they needed to employed. Flow pacing could then be used to run one basin at varying flows to reduce the head to the set point, at which point the flow was stopped. This required a change in the programming to provide more flexibility in flow control: a new flow control algorithm was developed by Ovivo which allowed the freeboard of the MBR to be used for equalisation.
3. Plant comparison
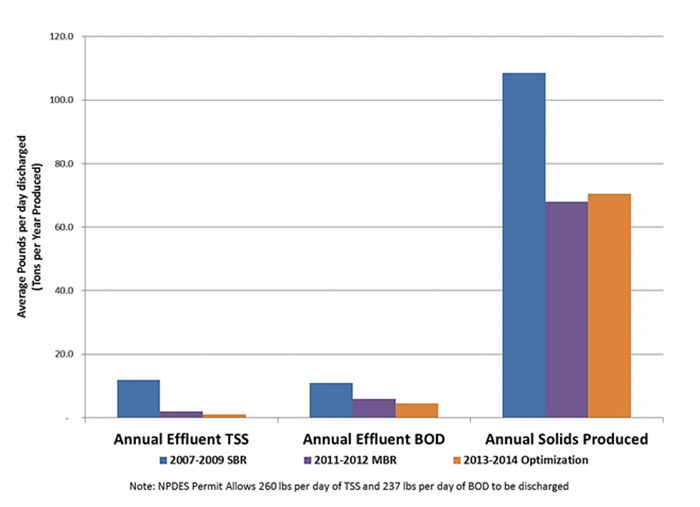
Despite the challenges, a number of efficiencies were noted or developed. The switch from the SBR to the MBR produced a 92% reduction in the total suspended solids and 57% reduction in BOD loads discharged to the receiving stream. The MBR also reduced the amount of biosolids produced by 32%, reducing the cost of residuals management (Fig. 4). Diffusers were inspected and cleaned to provide an improved aeration energy efficiency. Some of the permeate was reused as utility water within the plant.
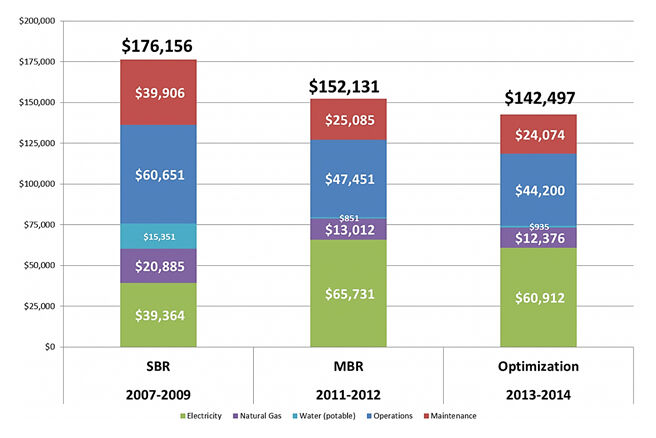
An examination of the actual costs of operation of the SBR and MBR (Fig. 5) revealed the MBR to be 13% lower in operating costs than the SBR prior to optimisation, and 19% less following optimisation of both the solids handling and the membrane operation. This comes about despite the greater energy demand of the MBR and is attributable to:
(a) the reduced operating and maintenance expenses − primarily from:
- a reduction in polymer and natural gas use associated with the decreased biosolids production and
- having staff free to do preventative maintenance instead of contracting repairs out, and
(b) the reuse of the treated water on site (resulting in a 95% reduction in potable water costs).
A further 25% reduction in the MBR air scour is envisaged in the future by increasing the flux rates and putting equipment on timers. Average fluxes largely between 4 and 10 GFD (7−17 LMH) have been maintained, peaking to 15−21 (25−36 LMH).
4. Conclusions
The experience of the MBR installation and operation at La Center has helped reinforce the general realisation that MBR technology is not necessarily the most expensive technical option for wastewater treatment. What is most surprising, however, is that, despite the higher energy demand, the operational costs can be lower than that of a conventional biological treatment process provided the design is sufficiently conservative and flexible. A more extensive and rigorous analysis is perhaps required to scrutinise the individual operating cost elements more closely, but it’s hard to argue with full-scale, real-life data based on meter readings and timesheets.


