Membrane ageing − a hard life?

Simon Judd has over 35 years’ post-doctorate experience in all aspects of water and wastewater treatment technology, both in academic and industrial R&D. He has (co-)authored six book titles and over 200 peer-reviewed publications in water and wastewater treatment.
Just like the rest of us, membranes get old and don’t always perform as well as they used to. Unlike us, on the other hand, this doesn’t manifest itself in things like creaking joints, failing to remember other people’s names or having difficulty getting up from low-slung sofas. With membranes, it’s basically just about two things: permeability and integrity.
Permeability is the flux (in LMH, GFD or day-1) per unit pressure (in kPa, bar or psi). It reflects how irrecoverably fouled the membranes have become, irrecoverable fouling being that which is not removed by either mechanical or chemical cleaning. Integrity, in this context, does not refer to the probity and honesty of the membrane, or whether it’s ever invested in aggressive tax-avoidance schemes or been caught shoplifting. It instead relates to the extent to which the membrane has become physically damaged to the point at which the rejection of key contaminants is impaired.
In the case of MBRs, the key contaminants of concern which are directly rejected by the membrane are usually the micro-organisms, since things like the BOD, ammonia and nutrients are essentially dealt with by the system biochemistry. But, again like us, not all micro-organisms are the same. Some are bigger than others, some are a bit more needy, and some are just plain awkward.
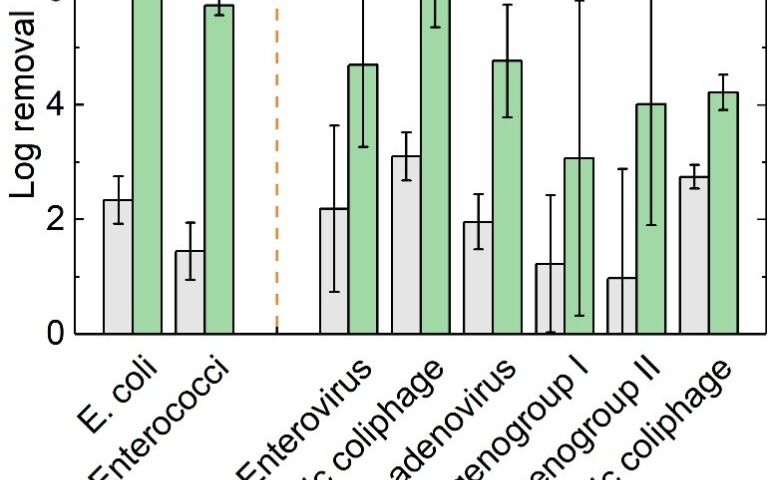
Bacteria, like Escherichia coli or Enterococcus faecalis, are generally around 1−2 microns in size and are ‘free swimming’ in water. To remove them effectively, the membrane pores (or the pores in the fouling layer sitting on the membrane) have to be well below 0.5 microns in size. The same is also true of the slightly larger Cryptosporidium oocysts, which have been responsible for sporadic high-profile outbreaks deriving from faecal-contaminated drinking water in communities globally. Viruses and phages, on the other hand, are fractions of micron in size but are predominantly associated with the suspended solids. Since the solids in an MBR mixed liquor are anywhere between 20 and 500 microns in size, removal of any microbes associated with them would be expected to be pretty much absolute – so long as the membrane retains its selectivity (i.e. rejects the pollutants it’s supposed to).
When membranes become irrecoverably fouled it’s normally because colloidal and other material has become trapped in the pores, and/or the pores themselves have collapsed. In either case, this tends to increase the selectivity but reduce the permeability. On the other hand, selectivity decreases with a loss of membrane integrity (i.e. when the active membrane layer – often no more than a few microns thick – is breached in some way).
The lifespan of a membrane is of key concern in determining operating expenditure (OPEX). It is the key critical component of any large membrane-based installation. Extending the replacement frequency from five to ten years can reduce the overall OPEX by almost 20% for an immersed hollow fibre MBR (Judd, 2017), and more so for a flat sheet system.
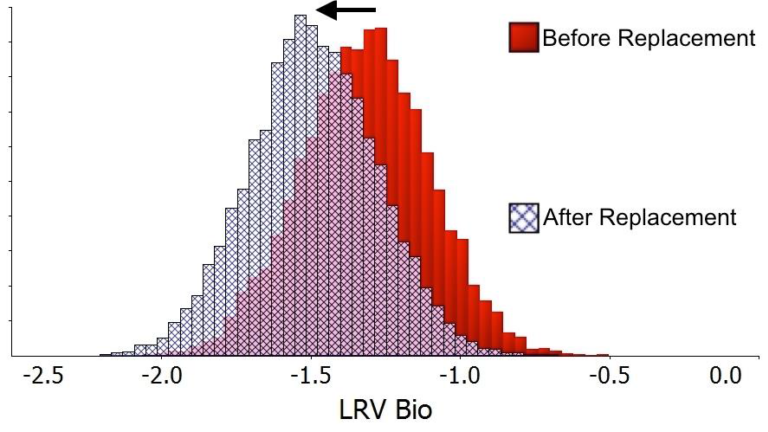
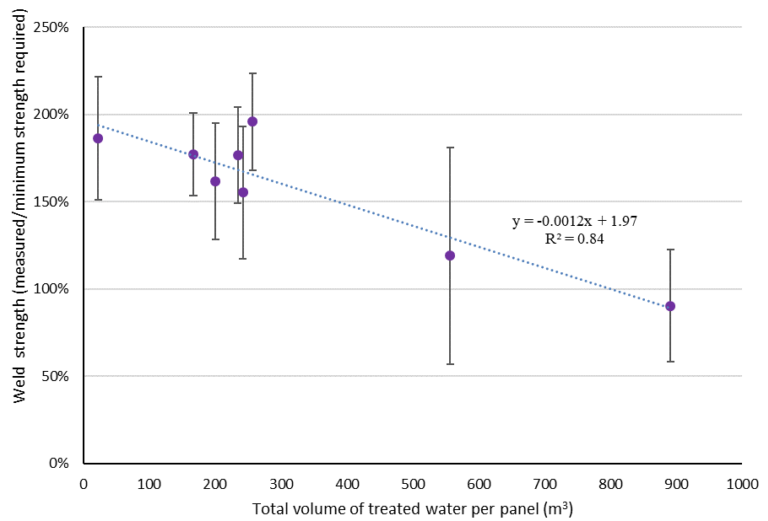
So, what determines the membrane life? Logic dictates that chemical cleaning is likely to degrade the membrane to some extent. Practical measurements made on membranes of various ages suggest a noticeable loss in mechanical strength of flat sheet membranes (Ayala et al, 2010) and of micro-organism rejection by hollow fibre membrane (Branch et al, 2016) for membranes in use for 6−10 years. However, a study of actual membrane life based on change out of membranes across a large number of installations suggested a life of at least 8 years, with more recent membrane products tending to offer longer life (Côté et al, 2012). And, of course, ceramic membranes would be expected to last a lot longer than this.
So, MBR membranes are apparently reflecting human trends and are tending to live longer, it seems. This is probably because of improvements made in each generation of products. But it could also partly be because designers are getting better at designing the plants so they need less looking after and/or operators are getting better at looking after them so that less chemical cleaning is required. Whatever the reason, the extended life is serving to decrease this part of the OPEX. It may be a hard life, but at least it’s apparently a reasonably long one.


