Comparing MBR technology with the MBBR and CAS: how do the numbers stack up?

Simon Judd, Judd Water & Wastewater Consultants
In this feature, Simon uses a modeling platform to benchmark conventional activated sludge with two alternative process technology options available for wastewater treatment – the moving bed bioreactor (MBBR) and the membrane bioreactor (MBR)
1. Wastewater treatment technology options
There are many process technology options available for wastewater treatment, and there is much debate as to the advantages offered by each of them. Any technology must firstly be capable of meeting the purification performance objective – i.e. achieve the required removal of the target pollutant(s) to meet the stipulated treated water quality. After this, most often the technology is selected on the basis of cost and/or carbon footprint – as well as physical footprint where there are spatial limitations.
The most ubiquitous biological wastewater treatment process is, of course, the conventional activated sludge (CAS) process. As such this is the process against which all other technologies tend to be benchmarked.
Two such variations of the CAS process include the moving bed bioreactor (MBBR) and the membrane bioreactor (MBR). The advantages offered by MBRs over CAS have been outlined qualitatively many times – including in this video. The primary characteristics of two key media-based biological treatment technologies, the MBBR and IFAS (integrated fixed-film activated sludge) processes, are also outlined elsewhere.
There can be little doubt that the addition of media and/or membranes to the CAS process offers a number of advantages. Of these, the treated wastewater quality – particularly with reference to its suspended solids, nutrient and/or pathogen content – is often the focus. However, the reality is that such treated water quality objectives can often be met with the CAS process supplemented by polishing with a filtration process. Indeed this is the most often-implemented approach for the treatment of wastewater for reuse.
So, before waxing lyrical about the new paradigm, how should it be established quantitatively that it represents an improvement over the old paradigm? Clearly, there needs to be some sort of benchmarking using widely accepted parameters.
2. Parameters for assessment
The principal parameters that are always considered when assessing any technology capable of meeting a water quality objective are cost (or expenditure) and environmental impact, and these are outlined elsewhere. Expenditure is normally categorised as either capital (hence CAPEX – sometimes referred to as investment), and operating (OPEX – or running costs). There are a number of types of cost analysis used to determine the combination of these two components to give the total cost (TOTEX).
The most common parameters used in environmental impact assessment (EIA) are specific energy consumption (SEC), and greenhouse gas (GHG) emissions and/or carbon footprint (CF). CF is particularly useful since it can encompass energy as well as the ‘embodied (or embedded) carbon’ in fixed assets, as well as other GHGs besides CO2. Pretty much everything can be quantified in terms of oxidation of carbon to carbon dioxide, and this is a key cornerstone of EIA. Determining costs, on the other hand, is fraught with challenges associated with impacts of geographical location, market susceptibilities and temporal trends.
The SEC is the energy consumption per unit volume of treated water, or the consumed power per unit treated water flow rate, and takes units of kWh/m3. kWh can be readily converted to emitted CO2, the conversion factor depending on the electricity power source (gas, coal, biomass, etc) and geographical location.
Regardless of the base parameter(s) used for any comparative appraisal between competing technologies, a key point of interest is the impact of plant size. In economics, the relationship between the cost and the amount of something produced in a manufacturing process (and so, by analogy, purified water generated by a wastewater treatment process) is referred to as a ‘cost curve’. It stands to reason, then, that the cost parameter can be substituted with CF to give the ‘CF curve’.
In the case of water and wastewater installations above a certain size – anything considered too large for containerised (‘package plant’) systems – a significant component of the embedded carbon is in the form of concrete and the associated aggregate materials (gravel, sand, crushed stone, etc). Since these are essentially non-renewable resources with, in the case of cement, a considerable energy consumption in the production process, they have an associated embedded carbon which can be determined with reasonable accuracy.
A rational basis for comparing the three technologies of interest is therefore a combination of the CF of the concrete used for the installation and SEC incurred by the plant operation, where the SEC is not normally a function of plant size for a system operating at a fixed energy efficiency. The impact of the other components of the system – principally the mechanical and electrical (M&E) components – is not taken into account, but can be assessed separately.
3. Baseline parameter values
The assumed feed water quality (Table 1) for this analysis is based on medium-strength municipal sewage with some industrial input. The treated water quality is based on widely applied standards for effluent discharge across the EU.
| Parameter | Influent | Treated |
|---|---|---|
| Chemical oxygen demand (COD), mg/L | 1000 | - |
| Biochemical oxygen demand (BOD5), mg/L | 270 | 20 |
| Total suspended solids (TSS), mg/L | 310 | 20 |
| Total Kjeldahl nitrogen (TKN), mg/L | 80 | - |
| Ammonia nitrogen (N-NH4), mg/L | 50 | 3 |
| Total nitrogen (TN), mg/L | - | 15 |
| Total phosphorus (TP), orthophosphate, mg/L | 8, 6 | 0.5 |
| pH | 7 | - |
| Alkalinity, mg/L as CaCO3 | 350 | - |
| Fat, oil and grease (FOG), mg/L | 50 | - |
| Design minimum wastewater temperature, °C | 17 | - |
| Design maximum wastewater temperature, °C | 22 | - |
For the purposes of this comparison study the process treatment schemes were assumed to:
- include screening and degritting as preliminary preatment,
- exclude primary sedimentation,
- have biological process configurations selected to achieved the required TN removal (e.g. the MLE configuration)
- include tertiary filtration, in the case of the CAS and the MBBR, to achieve comparable treated water TSS levels with that of the MBR,
- employ chemical dosing for phosphorus removal, and
- be based on a peak loading factor of around 2.5.
4. Calculation method
Calculating the CF and SEC of the three different processes across a range of wastewater flow capacities is a significant task to undertake from first principles. For the purposes of this article, use has been made of commercial design software which includes both the concrete CF and power consumption as two of the outputs.
The platform used, the Transcend Design Generator software, employs commonly-used activated sludge models (ASMs) and assumes appropriate values for unknown parameters, as necessary, to allow design of the plant. The design data outputs provided by the platform include:
a) process flow diagrams (PFDs) of the complete treatment scheme;
b) process biological treatment parameter values (retention times and MLSS);
c) bill of quantities for all civil construction work;
d) tank sizes and footprints relating to (c) above;
e) liquid and air flow rates for all streams;
f) a list of mechanical equipment and the accompanying specifications, including the pumps and blower specifications (from calculated required air flows) as well as all other equipment (screens, membranes, mixers, diffusers, etc);
g) itemisation of the electrical energy load associated with the mechanical equipment, including the daily estimated power consumption;
h) itemisation of required monitoring instrumentation;
i) embedded carbon;
j) site maps.
The comparative assessment was based on the figures provided for (g) and (i) above for average daily flow capacities between 4 and 25 megalitres per day (MLD).
5. Outputs
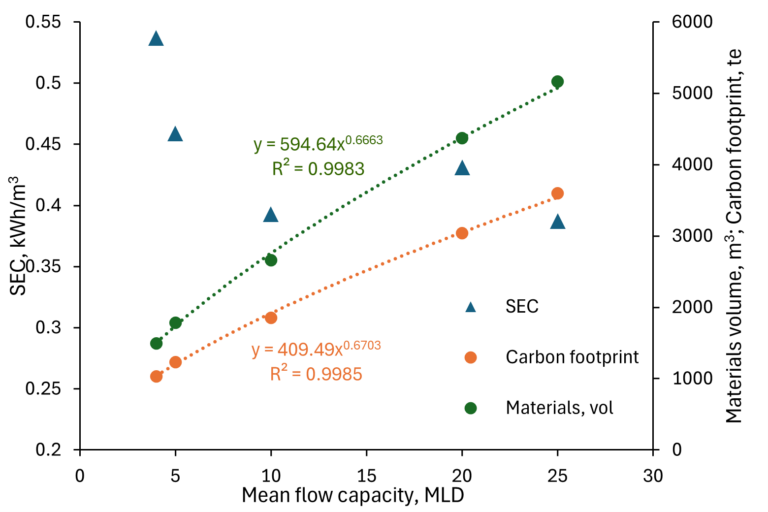
The curves produced indicate the extent to which the embedded carbon (representing a significant part of the civil engineering component of the cost) in tons of carbon (te C) and consumed energy (SEC) change with the plant size (or average plant flow capacity). A set of sample data for the CAS system (Fig. 1) reveals that, as expected, there is a close correlation between the volume of building materials and the CF incurred by these materials, the exponent for the respective curves being almost identical in value (–0.666 for materials volume vs –0.670 for CF). This implies that the concrete CF equates to around 0.69 te C per m3 material. In practice the embedded carbon of concrete varies significantly according to its composition and strength, but since this is a comparative analysis the exact conversion factor used is unimportant.
5.1. Energy consumption
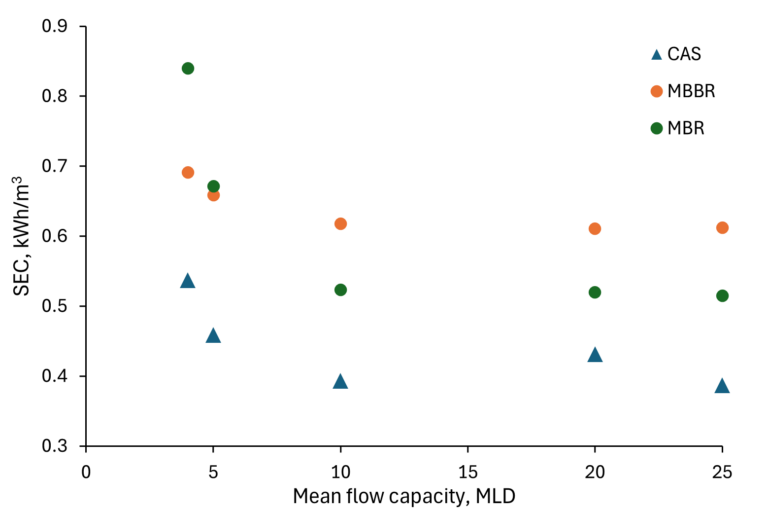
A plot of the SEC against flow (Fig. 2) reveals the expected trend of a decline at low flows to a near-constant baseline value at higher flows. In all three cases, above a mean flow capacity of around 10 MLD there is no significant change in the SEC. Based on the outputs provided by the Transcend platform, the baseline values for the SEC are around 0.40, 0.61 and 0.52 kWh/m3 for the CAS, MBBR and MBR respectively – roughly in line with the aeration demand (Table 2). However, the SEC increases more rapidly at lower flow capacities for the MBR than for the other two technologies. The SEC values for the MBR are in reasonable agreement with previously published values for optimised systems (Jalab et al, 2019; Qiblawey & Judd, 2019).
| Technology | Biological process step | Sludge mixing | Physical separation | Total |
|---|---|---|---|---|
| CAS | 2058 | 360 | - | 2418 |
| MBBR | 4265 | 498 | - | 4763 |
| MBR | 2009 | 261 | 1881 | 4151 |
5.2. Carbon footprint
The CF can be normalised against the flow in the same way as the absorbed power to produce the specific CF in kg C per MLD flow. Trends for this parameter (Fig. 3) show the same neo-exponential decline as for previously published trends for MBR-specific CAPEX in cost per unit flow. However, whereas the published exponent values for MBR specific CAPEX indicated exponent values between –0.38 and –0.55, the corresponding values for the CF are somewhat lower (–0.32 to –0.45). This may indicate the economy of scale with reference to the amount of concrete used in the wastewater installation to be slightly lower than that for the entire plant.
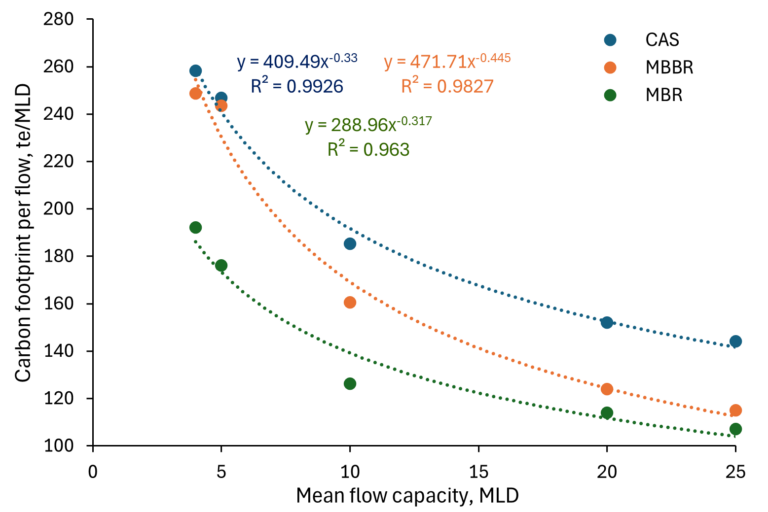
Figure 3 allows the CF trends of the three technologies to be directly compared. As is to be expected, the CAS incurs the largest CF with reference to concrete, aggregate and related building materials due to the larger tanks involved compared to the MBBR and MBR technologies. Conversely the MBR incurs a CF 25–30% lower than the CAS, the difference increasing with increasing flow capacity.
5.3. Physical footprint
The platform permits two approaches to estimating the plant footprint. Firstly, the footprint of the process biological tanks and the clarification tanks – either sedimentation or membrane-based for the latter – can be determined from the ratio of the tank volume to the depth. These results indicate a linear relationship between the tanks area footprint and flow capacity, with the MBR incurring a 42% lower footprint than the CAS. However, this figure excludes other components of the installation – principally the mechanical and process control components.
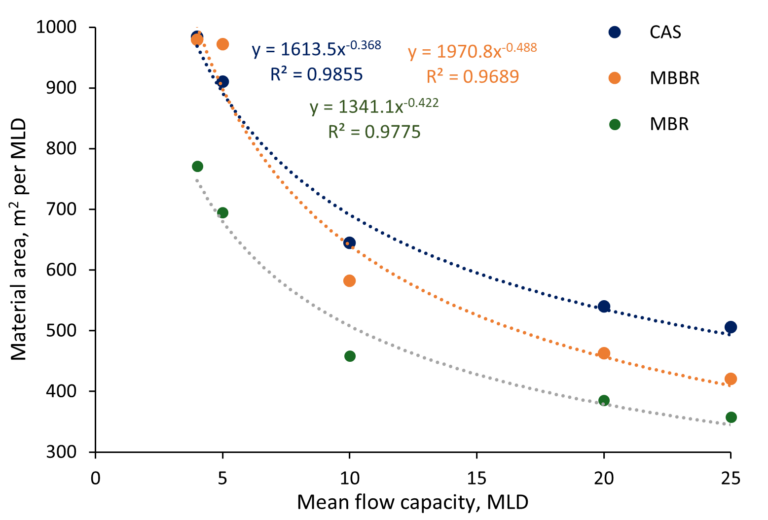
The platform also provides figures for the 'material area', where the material relates to the building materials (as with the material volume and CF). According to this data set (Fig. 4) the MBR incurs a 24–29% lower footprint than the CAS depending on the plant flow capacity - mirroring the CF trend.
6. Conclusions
Commercially-available wastewater treatment design platforms provide a means for obtaining values of key parameters determining cost and environmental impact for wastewater treatment process technologies. Using the Transcend platform permitted the generation of curves for the materials embodied carbon (or carbon footprint, CF) and specific energy consumption (SEC) – these being analogues of CAPEX and OPEX respectively – correlated with plant size (or treatment capacity). This then allowed quantitative comparison of plant size trends for the conventional activated sludge (CAS), moving bed bioreactor (MBBR) and membrane bioreactor (MBR) technologies.
The trends produced were found to be consistent with those published for CAPEX and OPEX, and were relatively simple to produce thanks to the intuitive nature of the platform. The outputs can be used to inform high-level studies where the optimum process technology across a range of flow capacities has to be determined on the basis of the relative change in SEC, CF, and/or spatial occupation.


