Anaerobic MBRs and non-potable water reuse: a good match?

Yu Huang, Paul Jeffrey and Marc Pidou
Water Science Institute, Cranfield University, UK. This feature was adapted from a review article by the authors, Huang, Y., Jeffrey, P., and Pidou, M. (2024). Municipal wastewater treatment with anaerobic membrane bioreactors for non-potable reuse: A review. Critical Reviews in Environmental Science and Technology, 54(10), 817–839. https://doi.org/10.1080/10643389.2023.2279886
1. Introduction
1.1 Water reuse
Recent years have seen major advances in regulatory frameworks at national and international levels supporting water reuse by setting quantitative limits for water quality parameters such as organics, solids, nutrients and pathogenic indicators (CNEPA, 2021; EUPC, 2020; USEPA, 2012). These standards demand more advanced purification than that attainable by conventional wastewater treatment, and has led to the widespread implementation of membrane technology − including MBRs − in indirect potable reuse (IPR) projects.
1.2 Anaerobic MBRs
Anaerobic MBRs (AnMBRs) offer a low-energy option for producing a potentially reusable product water from a wastewater feed. AnMBRs, and anaerobic processes generally, offer the advantage of reduced energy consumption (due to the avoidance of air pumping) and reduced sludge yields compared with aerobic processes. As an anaerobic process, AnMBRs generate a methane-rich biogas, the latent energy of which can offset the energy demand of wastewater treatment. They also convert nutrients to chemically-available forms such as ammonia and phosphate, facilitating nutrient recovery through, for example, precipitation and/or reuse of the nutrient-rich effluent in agriculture.
Integrating the anaerobic bioreactor with a membrane offers similar advantages to the aerobic MBR process, namely:
- decoupling the hydraulic and solids retention times
- reducing the overall process footprint, and
- producing a clarified, largely disinfected and potentially reusable product water from a wastewater feed – provided the high nutrient content can be managed in the case of the anaerobic process.
The development and implementation of AnMBRs for water reuse is, as with most water process technologies, largely driven by legislation. It is therefore informative to consider the relevant water quality standards which apply to non-potable reuse (NPR).
2. NPR water quality standards
Water quality standards identify maximum allowable pollutant levels for water delivered for different uses, where uses with a higher likelihood of human contact are generally subject to more stringent control (Tables 1a−1g). Levels of indicator bacteria, invariably faecal coliforms or E Coli, are for example prescribed for uses such as toilet flushing, recreational use and irrigation in many countries. Additional protection against microbial risk is often through a stipulated chlorine residual in the delivered water, typically with a required concentration above 1mg/L. However, there is significant variation in other parameter values across the different applications (e.g. TSS, organic matter and nutrients), with nutrients appearing only in the Chinese regulations.
| Parameter | USA | China | Australia |
|---|---|---|---|
[a] colony-forming unit, CFU/100 mL or most probable number, MPN/100 mL; [b] case-by-case basis; med median value; max maximum value; min minimum value | |||
| pH | - | 6.0−9.0 | [b] |
| BOD5 (mg O2/L) | ≤30 | ≤10 (6) | [b] |
| COD (mg/L) | - | ≤40 (30) | [b] |
| TSS (mg/L) | ≤30 | ≤20 (10) | [b] |
| Colour (colour or Hazen units) | - | ≤30 | [b] |
| TN (mg N/L) | - | ≤15 | [b] |
| NH3-N (mg N/L) | - | ≤5 | [b] |
| TP (mg P/L) | - | ≤1 (0.5) | [b] |
| Faecal coliforms [a] | ≤200 (7d med) ≤800 (max) | ≤1000 (200) | <10000 CFU/100ml |
| Chlorine residual (mg/L); Contact time | ≥1.0 (90 min) | ≥0.5 | - |
| Parameter | USA (restricted area) | USA (unrestricted area) | China | Japan (unrestricted area) |
|---|---|---|---|---|
nd not detectable | ||||
| pH | - | 6.0−9.0 | 6.0−9.0 | 5.8−8.6 |
| BOD5 (mg O2/L) | ≤30 | ≤10 | ≤6 | - |
| COD (mg/L) | - | - | ≤30 | - |
| TSS (mg/L) | ≤30 | - | - | - |
| Colour (colour or Hazen units) | - | - | ≤30 | ≤10 |
| Turbidity (NTU or mg-kaolin/L) | - | ≤2 NTU | ≤5 NTU | <2 mg-kaolin/L |
| NH3-N (mg N/L) | - | - | ≤5 | - |
| TN (mg N/L) | - | - | ≤15 | - |
| TP (mg P/L) | - | - | ≤1 (0.5) | - |
| Faecal coliforms [a] | ≤200 (7d med) ≤800 (max) | nd (7d med), ≤14(max) | ≤50 (nd) | - |
| E. coli [a] | - | - | - | nd |
| Chlorine residual (mg/L); Contact time | ≥1.0; 90min | ≥1.0; 90min | ≥0.05 | >0.1 free, >0.4 combined |
| Parameter | USA (restricted area) | China | Japan | Australia |
|---|---|---|---|---|
[a] colony-forming unit, CFU/100 mL or most probable number, MPN/100 mL | ||||
| pH | 6.0−9.0 | 6.0−9.0 | 5.8−8.6 | - |
| BOD5 (mg O2/L) | ≤30 | ≤20 | - | ≤20 |
| COD (mg/L) | - | ≤1000 | - | - |
| TSS (mg/L) | ≤30 | - | - | ≤30 |
| Colour (colour or Hazen units) | - | ≤30 | ≤40 | - |
| Turbidity (NTU or mg-kaolin/L) | - | ≤10 NTU | ≤2 mg-kaolin/L | - |
| NH3-N (mg N/L) | - | ≤20 | - | - |
| Faecal coliforms [a] | - | ≤200 | - | - |
| E. coli [a] | ≤200 (7d med) ≤800 (max) | - | - | ≤ 1000 (if not disinfected) |
| Total coliforms (MPN/100 mL) | - | - | ≤1000 (temporary) | - |
| TDS (mg/L) | - | ≤1000 | - | - |
| Chlorine residual (mg/L); Contact time | ≥1.0; 90min | - | - | - |
| Parameter | USA (FCR) | USA (FCP/FCN) | China (farming/forestry) | China (animal husbandry) | Australia (FCR) | Australia (FCP/FCN) | EU (FCR) | EU (FCP/FCN) |
|---|---|---|---|---|---|---|---|---|
[a] colony-forming unit, CFU/100 mL or most probable number, [b] case-by-case basis; FCR Food crops consumed raw; FCP Food crops consumed after processing; FCN: Non-food crops; nd not detectable. | ||||||||
| pH | 6.0−9.0 | 6.0−9.0 | 5.5-8.5 | [b] | - | - | ||
| BOD5 (mg O2/L) | ≤10 | ≤30 | ≤35 | ≤10 | [b] | <20 | ≤10 | ≤25 |
| COD (mg/L) | - | - | ≤90 | ≤40 | [b] | - | - | ≤125 |
| TSS (mg/L) | - | ≤30 | ≤30 | [b] | <30 | ≤10 | ≤35 | |
| Colour (colour or Hazen units) | - | - | ≤30 | [b] | - | - | - | |
| Turbidity (NTU or mg-kaolin/L) | - | - | ≤10 NTU | [b] | - | ≤5 | - | |
| NH3-N (mg N/L) | - | - | ≤10 | ≤10 | [b] | - | - | - |
| Faecal coliforms [a] | nd (7d med) ≤14 (max) | ≤200 | ≤10000 | ≤2000 | [b] | - | - | - |
| E. coli [a] | - | - | - | - | < 1 | < 100 | ≤10 or nd | ≤100 (FCP, <1000 (FCN) |
| Chlorine residual (mg/L); Contact time | ≥1.0 (90min) | ≥1.0 (90min) | - | - | - | - | ||
| Parameters | USA | China | Japan | Australia |
|---|---|---|---|---|
[a] colony-forming unit, CFU/100 mL or most probable number, [b] case-by-case basis; FCR Food crops consumed raw; FCP Food crops consumed after processing; FCN: Non-food crops; nd not detectable; pou point of use | ||||
| pH | 6.0-9.0 | 6.0-9.0 | 5.8-8.6 | [b] |
| BOD5 (mg O2/L) | ≤10 | ≤10 | - | [b] |
| TSS (mg/L) | - | ≤1500 | - | [b] |
| Colour (colour or Hazen units) | - | ≤30 | - | [b] |
| Turbidity (NTU or mg-kaolin/L) | ≤2 NTU | ≤5 NTU | ≤2 mg-kaolin/L | [b] |
| NH3-N (mg N/L) | - | ≤10 | - | [b] |
| Faecal coliforms [a] | nd (7d med) ≤14 (max) | - | - | [b] |
| E. coli [a] | - | - | nd | < 1 |
| Total coliforms (MPN/100 mL) | - | ≤3 | - | - |
| TDS (mg/L) | - | ≤1500 | - | - |
| Chlorine residual (mg/L); Contact time | ≥1.0; 90min | ≥1.0; 30min. ≥0.2 (at pou) | >0.1 free, >0.4 combined | - |
| Parameter | China | Japan | Spain | Australia | |
|---|---|---|---|---|---|
[a] colony-forming unit, CFU/100 mL or most probable number; nd not detectable | |||||
| pH | 6.0−9.0 | 6.0−9.0 | 5.8−8.6 | - | |
| BOD5 (mg O2/L) | ≤10 | ≤15 | - | - | |
| TSS (mg/L) | - | ≤1500 | - | ≤20 | |
| Colour (colour or Hazen units) | - | ≤30 | - | - | |
| Turbidity (NTU or mg-kaolin/L) | ≤2 NTU | ≤10 NTU | ≤2 mg-kaolin/L | ≤10 NTU | |
| NH3-N (mg N/L) | - | ≤10 | - | - | |
| Faecal coliforms [a] | nd (7d med) ≤14 (max) | - | - | - | |
| E. coli [a] | - | - | nd | ≤200 | |
| Total coliforms (MPN/100 mL) | - | ≤3 | - | - | |
| Parameter | USA (once-through cooling) | China (cooling) | China (washing) | China (boiler feed) | EU |
|---|---|---|---|---|---|
| pH | 6.0−9.0 | 6.5−8.5 | 6.5−9.0 | 6.5−8.5 | |
| BOD5 (mg O2/L) | ≤30 | ≤15 | ≤15 | ≤15 | |
| COD (mg/L) | - | ≤60 | ≤60 | ≤60 | |
| TSS (mg/L) | ≤30 | - | - | - | |
| Colour (colour or Hazen units) | - | ≤10 | ≤30 | ≤10 | |
| Turbidity (NTU or mg-kaolin/L) | - | ≤5 NTU | ≤5 NTU | ≤5 NTU | |
| NH3-N (mg N/L) | - | ≤10 | ≤10 | ≤10 | |
| Faecal coliforms (CFU/100 mL or MPN/100 mL) | ≤200 | ≤2000 | ≤2000 | ≤2000 | |
| E. coli (CFU/100 mL or MPN/100 mL) | - | - | - | - | |
| Chlorine residual (mg/L); Contact time | ≥1.0; 90min | - | - | - |
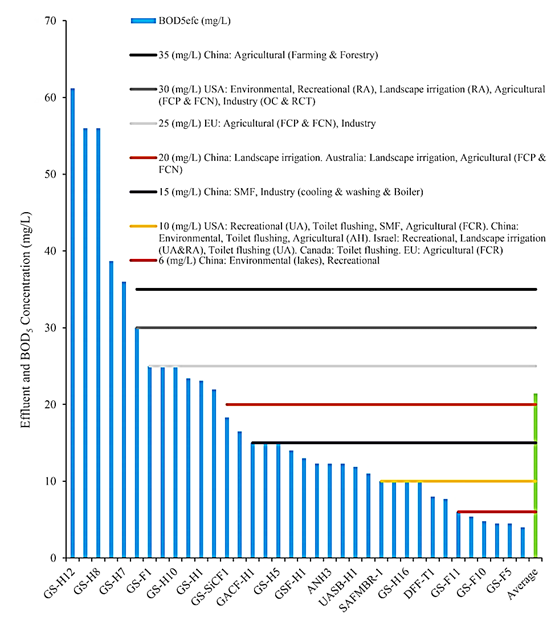
BOD5 is universally used to represent organic matter in the NPR reuse standards, the permitted limit ranging from 6 to 30mg/L (Table 2) according to the end use application; e.g. toilet flushing (Table 1e) has a lower limit than irrigation (Tables 1c and 1d). Emerging organic contaminants such as pharmaceutical residues, endocrine disruptors, and personal care product residues are poorly covered in NPR standards.
| Limit | Region: application |
|---|---|
RA Restricted area; UA Unrestricted area; FCR Food crops with raw consumer; FCP Food crops consumed after processing; FCN Non-food crops; AH Animal husbandry; OC Once-through cooling; RCT Recirculation cooling towers; SMF Street maintenance and firefighting. | |
| ≤35 | China: Agricultural (Farming & Forestry) |
| ≤30 | USA: Environmental, Recreational (RA), Landscape irrigation (RA), Agricultural (FCP & FCN), Industry (OC & RCT) |
| ≤25 | EU: Agricultural (FCP & FCN), Industry |
| ≤20 | China: Landscape irrigation. Australia: Landscape irrigation, Agricultural (FCP & FCN) |
| ≤15 | China: SMF, Industry (cooling & washing & Boiler) |
| ≤10 | USA: Recreational (UA), Toilet flushing, SMF, Agricultural (FCR). China: Environmental, Toilet flushing, Agricultural (AH). Israel: Recreational, Landscape irrigation (UA & RA), Toilet flushing (UA). Canada: Toilet flushing. EU: Agricultural (FCR) |
| ≤6 | China: Environmental (lakes), Recreational |
3. AnMBR research outcomes
Whilst there has been considerable research into AnMBRs for wastewater treatment generally, full-scale implementation has been largely based on the treatment of high-strength industrial effluents. Implementation for water reuse specifically has been very limited.
Assessing the suitability of the AnMBR technology for municipal wastewater NPR can be carried out by considering the individual systems studied and reported on at bench/pilot scale and the treated water quality achieved from these studies with respect to the individual determinants. The systems considered based on an exhaustive review of the research literature are listed in Table 3, with each assigned a unique code summarising the system characteristics with reference to reactor and membrane configuration, anti-fouling strategy, and other facets. For example, GS-F1 indicates an AnMBR operated with gas sparging (GS) for fouling control and a flat sheet (F) membrane module; PFPS-H1 concerns a plug flow (PF) partially stirred (PS) bioreactor with a hollow fibre (H) membrane.
| Code | Reference | Reactor | Membrane configuration/material |
|---|---|---|---|
Shear application GS: Gas sparging; PS: Particle sparging; RM: Rotating membrane; DM: Dynamic membrane; GL: Gas lifting; NGS: Non gas sparging Membrane configuration F: Flat sheet; H: Hollow fibre; C: Ceramic; T: Tubular; CT: Ceramic tubular; SiCF: Silicon Carbide ceramic flat sheet Carrier PAC: Powdered activated carbon; GACF: Granular activated carbon, fluidised Mixing AN: AnMBR with no sparging; PFPS: Plug flow, partially stirred; CSTR: Continuously stirred tank reactor; FBR: Fluidised-bed reactor; DFF: Downflow floating media filter; UASB: Upflow anaerobic sludge bed Solids and reactor configuration CG: Conventional granular; SG: Sponge-assisted granular; GSG: Granular sludge with gas sparging; GSF: Flocculant sludge with gas sparging; SAFMBR: Staged anaerobic fluidized MBR | |||
| AN-F1 | Vyrides, et al., 2010 | AnMBR without sparging | Flat sheet |
| AN-H1 | Pretel et al., 2016 | AnMBR without sparging | Hollow fibre |
| AN-H2 | Ferrari et al., 2019 | AnMBR without sparging | Hollow fibre |
| AN-H3 | Ding et al., 2019 | AnMBR without sparging | Hollow fibre |
| AN-H4 | Ding et al., 2019 | AnMBR without sparging | Hollow fibre |
| CG-H1 | Chen et al., 2017 | Conventional granular sludge | Hollow fibre |
| CSTR-H1 | Wei et al., 2014 | Completely stirred tank reactor | Hollow fibre |
| DFF-T1 | Seib et al., 2016 | Downflow floating media filter | Tubular |
| FBR-CT1 | Seib et al., 2016 | Fluidised-bed reactor | Ceramic tubular |
| GACF-H1 | Evans et al., 2019 | Granular activated carbon, fluidised | Hollow fibre |
| GL-T1 | Dolejs et al., 2017 | Gas lifting | Tubular |
| GS-C1 | Song et al., 2018a | Gas sparging | Ceramic |
| GSDM-F1 | Hu et al., 2020 | Gas sparged dynamic membrane | Flat sheet |
| GS-F1 | Martinez-Sosa et al., 2011 | Gas sparging | Flat sheet |
| GS-F10 | Kunacheva et al., 2017 | Gas sparging | Flat sheet |
| GS-F11 | Chen et al., 2019 | Gas sparging | Flat sheet |
| GS-F3 | Zhou et al., 2016 | Gas sparging | Flat sheet |
| GS-F4 | Thanh et al., 2017 | Gas sparging | Flat sheet |
| GS-F5 | Kunacheva et al., 2017 | Gas sparging | Flat sheet |
| GS-F6 | Trzcinski & Stuckey, 2016 | Gas sparging | Flat sheet |
| GS-F7 | Fox & Stuckey, 2015 | Gas sparging | Flat sheet |
| GS-F8 | Zhang et al., 2017 | Gas sparging | Flat sheet |
| GS-F9 | Xiao et al., 2017 | Gas sparging | Flat sheet |
| GSF-H1 | Wang et al., 2019 | Flocculant sludge with gas sparging | Hollow fibre |
| GS-FPAC1 | Akram & Stuckey, 2008 | Gas sparging, with powdered activated carbon | Flat sheet |
| GSG-H1 | Wang et al., 2018 | Granular sludge with gas sparging | Hollow fibre |
| GSG-H2 | Martin et al., 2013 | Granular sludge with gas sparging | Hollow fibre |
| GS-H1 | Giménez et al., 2011 | Gas sparging | Hollow fibre |
| GS-H3 | Robles et al., 2013 | Gas sparging | Hollow fibre |
| GS-H5 | Mei et al., 2018 | Gas sparging | Hollow fibre |
| GS-H6 | Dong et al., 2016 | Gas sparging | Hollow fibre |
| GS-H7 | Gouveia et al., 2015 | Gas sparging | Hollow fibre |
| GS-H8 | Gouveia et al., 2015 | Gas sparging | Hollow fibre |
| GS-H9 | Wang et al., 2019 | Gas sparging | Hollow fibre |
| GS-H10 | Evans et al., 2019 | Gas sparging | Hollow fibre |
| GS-H11 | Khan et al., 2019 | Gas sparging | Hollow fibre |
| GS-H12 | Peña et al., 2019 | Gas sparging | Hollow fibre |
| GS-H13 | Seco et al., 2018 | Gas sparging | Hollow fibre |
| GS-H14 | Gu et al., 2019 | Gas sparging | Hollow fibre |
| GS-H15 | Wang et al., 2018 | Gas sparging | Hollow fibre |
| GS-H16 | Martin et al., 2013 | Gas sparging | Hollow fibre |
| GS-SiCF1 | Cho et al., 2019 | Gas sparging | Silicon carbide flat sheet |
| GS-T1 | Cerón-Vivas & Noyola, 2017 | Gas sparging | Tubular |
| NGS-T1 | Cerón-Vivas & Noyola, 2017 | Non gas sparging | Tubular |
| PFPS-H1 | Bair et al., 2015 | Plug flow, partially stirred | Hollow fibre |
| PS-H1 | Shin et al, 2014 | Particle sparging | Hollow fibre |
| RM-H1 | Ruigómez et al., 2016 | Rotating membrane | Hollow fibre |
| SAFMBR-1 | Chen et al., 2019 | Staged anaerobic fluidized MBR | Hollow fibre |
| SGH1 | Chen et al., 2017 | Sponge-assisted granular | Hollow fibre |
| UASB-H1 | Petropoulos et al., 2019 | Upflow anaerobic sludge bed | Hollow fibre |
Details of the plant design and operational parameters are listed in Table 4. Table 5 provides the overall purification performance and methane yield. Whilst water reuse regulations typically target BOD5 as the organic content indicator, most research studies focusing on wastewater treatment for discharge use COD: only 16 of the 50 studies reported the effluent BOD5 concentration compared to 37 reporting COD. For the purposes of the evaluation, BOD5 values were estimated from the reported COD values assuming a BOD5/COD ratio of 0.3 (±0.1) – the mean ratio of those 16 studies where both COD and BOD5 data were available.
| Code | V, L | A, m^2 | HRT, h | SRT, d | OLR, kgCOD/m3/d | T, degC | Flux, L/m^2/h |
|---|---|---|---|---|---|---|---|
V Reactor volume; A Membrane surface area; HRT hydraulic retention time; SRT Solids retention time; OLR Organic loading rate; N/A Not available | |||||||
| GS-F1 | 350 | 3.5 | 19 | 680 | 0.85 | 35 | 7 |
| GS-H1 | 800 | 30 | 12 | 70 | 1 | 33 | 10 |
| GS-H3 | 1300 | 30 | 12 | 70 | 1.2 | 33 | 10 |
| GS-H5 | 25 | 5.4 | 2 | N/A | 3 | 35 | 6 |
| GS-H6 | 550 | 5.4 | 9 | 70 | 1 | 23 | 17 |
| GS-H7 | 25 | 0.93 | 7 | infinite | 2 | 18 | 17 |
| GS-H8 | 284 | 0.93 | 13.5 | N/A | 2.25 | 18 | 13 |
| PS-H1 | 1760 | 39.5 | 5 | 36 | 1.75 | 30 | 6 |
| RM-H1 | 50 | 0.9 | 33 | 270 | 1.75 | 19 | 10 |
| GS-C1 | 20 | 0.09 | 96 | 215 | N/A | 35 | 2 |
| GS-H15 | 42.5 | 0.93 | 8 | N/A | N/A | 16.3 | 10 |
| GSG-H1 | 15 | 0.93 | 8 | N/A | N/A | 11 | 12 |
| GSF-H1 | 15 | 0.93 | 8 | N/A | N/A | 11 | 12 |
| GS-H9 | N/A | N/A | N/A | N/A | N/A | 23.5 | N/A |
| GS-H10 | 1300 | 12.9 | 13 | 60 | 1.3 | 20.6 | 7.6 |
| GACF-H1 | 990 | 60 | 3.9 | 11 | 1.4 | 22.5 | 7.9 |
| PFPS-H1 | 1714 | 13.2 | 50.4 | 140 | 1 | 60 | 2 |
| CSTR-H1 | 2 | 0.003 | 12 | 1000 | 0.8 | 35 | 6 |
| DFF-T1 | 2.3 | 0.059 | 8 | N/A | N/A | 25 | 6 |
| FBR-CT1 | 2.3 | 0.05 | 8 | N/A | N/A | 25 | 6 |
| UASB-H1 | N/A | N/A | 0.32 | N/A | 1.6 | 15 | 7 |
| NGS-T1 | 700 | 0.238 | 8 | N/A | N/A | 20 | 2.5 |
| GS-T1 | 700 | 0.238 | 8 | N/A | N/A | 19.6 | 2.5 |
| CGH1 | 3 | 0.06 | 12 | N/A | N/A | 20 | 5.3 |
| SGH1 | 3 | 0.06 | 12 | N/A | N/A | 20 | 5.3 |
| ANH1 | 900 | 31 | 22 | 40 | N/A | 25 | 15.8 |
| GL-T1 | 13 | 0.066 | 30 | N/A | 0.619 | 35 | 4.5 |
| ANH2 | 5.4 | 0.125 | 30 | 103 | 1.3 | 34 | 2.1 |
| ANF1 | 5 | 0.1 | 12 | N/A | 2 | 35 | 9 |
| GS-F3 | 3.2 | 0.1 | 12 | 200 | N/A | 36.5 | 30 |
| GS-F4 | 3.2 | 0.1 | 6 | 100 | N/A | 36.5 | 30 |
| GS-F5 | 3 | 0.116 | 6 | 200 | N/A | 35 | 15 |
| GS-F6 | 3 | 0.1 | 5 | N/A | N/A | N/A | N/A |
| GS-FPAC1 | 3 | 0.1 | 6 | 250 | 16 | 35 | 5 |
| GS-F7 | 3 | 0.1 | 12 | N/A | N/A | N/A | 6 |
| GS-H16 | 1000 | 12.5 | 16 | 100 | N/A | 25 | 6 |
| GSG-H2 | 85 | 0.93 | 16 | 100 | N/A | 25 | 6 |
| GS-F8 | N/A | 0.11 | 6 | 150 | N/A | 35 | 26 |
| GS-F9 | 3.2 | 0.11 | 6 | 213 | N/A | 35 | 5 |
| GS-F10 | 3 | 0.116 | 4 | 200 | N/A | 35 | 15 |
| GS-H11 | 3.5 | 0.08 | 8 | 60 | 0.55 | 22 | N/A |
| GS-H12 | 318 | 1.86 | 6 | N/A | N/A | 24 | 12 |
| GS-F11 | 3.5 | 0.08 | 6 | 120 | N/A | 35 | 15 |
| GS-H13 | 1300 | 31 | 24.4 | 140 | 0.49 | 27 | N/A |
| GS-SiCF1 | 500 | 6.02 | 8.2 | 250 | 3 | 35 | 10.1 |
| GSDM-F1 | 3.5 | 0.02 | 8 | infinite | 0.88 | 20 | 22.5 |
| SAFMBR-1 | 9 | 0.158 | 4.5 | N/A | 1.83 | N/A | 5.6 |
| ANH3 | 8 | 0.2 | 12 | 300 | N/A | 35 | 1.68 |
| ANH4 | 8 | 0.2 | 12 | 300 | N/A | 25 | 1.68 |
| GS-H14 | 5 | 0.78 | 6.4 | N/A | N/A | 30 | 10 |
| Average | 323 | 6.2 | 12 | 195 | 2.1 | 28 | 9.7 |
| Code | Influent | CODin | CODout | BODin | BODout | TSSin | TSSout | N-NH3in | N-NH3out | TPin | TPout | pH | MY |
|---|---|---|---|---|---|---|---|---|---|---|---|---|---|
All concentration units mg/L other than pH and MY; MY Methane yield (L CH4/g CODremoved); RS Raw sewage; SS Settled sewage; FS Faecal sewage; SW Synthetic wastewater; SPE Synthetic primary effluent; OFMSW Organic fraction of municipal solid waste; MRW Mixed raw sewage; CSW Concentrated synthetic wastewater | |||||||||||||
| GS-F1 | RS | 630 | 80 | 396 | 25 | N/A | N/A | 61.5 | 67.4 | 8.2 | 7.1 | 6.8 | 0.27 |
| GS-H1 | RS | 445 | 77 | N/A | N/A | 186 | N/A | 27 | 33.4 | 2.7 | 3.1 | 6.72 | 0.07 |
| GS-H3 | RS | 459 | 100 | N/A | N/A | 242 | N/A | 28.6 | N/A | 3.1 | N/A | 6.75 | N/A |
| GS-H5 | RS | 396 | 50 | N/A | N/A | N/A | N/A | 36.7 | 34.2 | 10.4 | 6.5 | 6.9 | 0.12 |
| GS-H6 | RS | 383 | 36.2 | 141 | 7.7 | N/A | N/A | 40 | 28 | 5.1 | 2.7 | 6.75 | 0.1 |
| GS-H7 | SS | 892 | 122 | 573 | 36 | 123 | N/A | 71 | 74 | 10 | 23.8 | N/A | 0.25 |
| GS-H8 | SS | 978 | 120 | 474 | 56 | 83 | N/A | 75 | 83.2 | 10 | 10 | 7.2 | 0.23 |
| PS-H1 | SS | 280 | 14 | 160 | 10 | 165 | ND | N/A | 34 | N/A | 3.7 | 6.7 | 0.215 |
| RM-H1 | RS | 1462 | 129 | N/A | N/A | 960 | N/A | 38.9 | 36.2 | 22.5 | 20 | 7.5 | 0.212 |
| GS-C1 | SW | 6252.3 | 101.5 | N/A | N/A | N/A | N/A | 34.7 | 346.3 | 195.4 | 213.7 | 7 | N/A |
| GS-H15 | SS | 221 | 41 | 106 | 11 | N/A | N/A | N/A | N/A | N/A | N/A | 8.2 | N/A |
| GSG-H1 | SS | 168 | 39 | 88 | 10 | 105 | ND | N/A | N/A | N/A | N/A | 8.1 | N/A |
| GSF-H1 | SS | 208 | 34 | 138 | 13 | 127 | ND | N/A | N/A | N/A | N/A | 7.7 | N/A |
| GS-H9 | RS | N/A | N/A | N/A | N/A | N/A | 5.33 | N/A | 34.9 | N/A | 9.42 | N/A | N/A |
| GS-H10 | SS | 620 | 58 | 250 | 25 | 330 | N/A | N/A | N/A | N/A | N/A | N/A | N/A |
| GACF-H1 | SS | 210 | 29 | 140 | 15 | 120 | N/A | N/A | N/A | N/A | N/A | N/A | N/A |
| PFPS-H1 | FS | 2700 | N/A | N/A | N/A | N/A | N/A | N/A | N/A | N/A | N/A | N/A | 0.35 |
| CSTR-H1 | SW | 400 | 50 | N/A | N/A | N/A | N/A | N/A | N/A | N/A | N/A | 7 | 0.3 |
| DFF-T1 | SPE | 500 | 14 | 235 | 4 | 120 | N/A | 43 | N/A | 2.5 | N/A | N/A | N/A |
| FBR-CT1 | SPE | 500 | 25 | 235 | 8 | 120 | N/A | 43 | N/A | 2.5 | N/A | N/A | N/A |
| UASB-H1 | SS | 100 | 39.6 | N/A | N/A | 244 | N/A | N/A | N/A | N/A | N/A | 7 | 0.09 |
| NGS-T1 | RS | 525 | 150 | N/A | N/A | 515 | 16 | N/A | N/A | N/A | N/A | 7.9 | N/A |
| GS-T1 | RS | 657 | 78 | N/A | N/A | 1307 | 47 | N/A | N/A | N/A | N/A | 7.8 | N/A |
| CGH1 | SW | 330 | N/A | N/A | N/A | N/A | N/A | 6.05 | N/A | 3.35 | N/A | 7 | N/A |
| SGH1 | SW | 330 | N/A | N/A | N/A | N/A | N/A | 6.05 | N/A | 3.35 | N/A | 7 | N/A |
| ANH1 | RS | 643 | N/A | N/A | N/A | 260 | N/A | 49.6 | N/A | 5 | N/A | N/A | 0.35 |
| GL-T1 | SW | 1000 | 55 | 400 | N/A | N/A | N/A | N/A | 33 | N/A | 16 | 7.75 | 0.19 |
| ANH2 | SW | 1720 | 86 | N/A | N/A | N/A | N/A | 39 | N/A | 60 | N/A | N/A | N/A |
| ANF1 | SW | 465 | N/A | N/A | N/A | N/A | N/A | 10 | N/A | 8 | N/A | N/A | N/A |
| GS-F3 | SW | 460 | 15 | N/A | N/A | N/A | N/A | N/A | N/A | N/A | N/A | 6.8 | 0.3 |
| GS-F4 | SW | 500 | N/A | N/A | N/A | N/A | N/A | N/A | N/A | N/A | N/A | 7 | N/A |
| GS-F5 | SW | 466 | 15 | N/A | N/A | N/A | N/A | N/A | N/A | N/A | N/A | 7 | 0.252 |
| GS-F6 | OFMSW | 1410 | 400 | N/A | N/A | N/A | N/A | N/A | N/A | N/A | N/A | N/A | N/A |
| GS-FPAC1 | SW | 4000 | 70 | N/A | N/A | N/A | N/A | N/A | N/A | N/A | N/A | 7 | N/A |
| GS-F7 | SW | 460 | N/A | N/A | N/A | N/A | N/A | N/A | N/A | N/A | N/A | 6.95 | N/A |
| GS-H16 | SS | 338 | 54 | 167 | 10 | 84 | ND | 35 | 40 | N/A | N/A | 8.1 | N/A |
| GSG-H2 | SS | 338 | 47 | 167 | 11 | 84 | ND | 35 | 39 | N/A | N/A | 8.1 | N/A |
| GS-F8 | SW | 500 | N/A | N/A | N/A | N/A | N/A | N/A | N/A | N/A | N/A | 7 | N/A |
| GS-F9 | SW | 500 | N/A | N/A | N/A | N/A | N/A | 100 | N/A | N/A | N/A | N/A | N/A |
| GS-F10 | SW | 484 | 12 | N/A | N/A | N/A | N/A | N/A | N/A | N/A | N/A | 7 | N/A |
| GS-H11 | SW | 550 | N/A | N/A | N/A | N/A | N/A | N/A | N/A | N/A | N/A | 7 | N/A |
| GS-H12 | RS | 1729 | 150 | N/A | N/A | 964 | N/A | 55.4 | 69.16 | 9.55 | 12.6 | 7.22 | N/A |
| GS-F11 | SW | 347 | 20 | N/A | N/A | N/A | N/A | N/A | N/A | N/A | N/A | N/A | N/A |
| GS-H13 | SS | 510 | 59 | 305 | 14 | 342 | 2 | 42.8 | 47.9 | 5.5 | 6.7 | N/A | N/A |
| GS-SiCF1 | MRW | 1138 | 61 | N/A | N/A | 942 | N/A | 9 | N/A | 14 | N/A | 7 | 0.09 |
| GSDM-F1 | SW | 292 | 73.2 | N/A | N/A | N/A | N/A | N/A | N/A | N/A | N/A | N/A | N/A |
| SAFMBR-1 | SW | 115 | 10.6 | 53 | 61.2 | 42 | N/A | 74 | N/A | 5 | N/A | 7 | N/A |
| ANH3 | SW | 570.41 | 40.94 | N/A | N/A | N/A | N/A | 36.03 | 44.93 | 4.84 | 6.08 | N/A | N/A |
| ANH4 | SW | 570.41 | 40.94 | N/A | N/A | N/A | N/A | 36.03 | 42.84 | 4.84 | 5.79 | N/A | N/A |
| GS-H14 | SW | 409 | 18 | N/A | N/A | N/A | N/A | 43.9 | 41.9 | 4.8 | 4.4 | N/A | 0.28 |
| Average | N/A | 807 | 68 | 237 | 20 | 339 | 18 | 41 | 64 | 18 | 23 | 7.22 | 0.212 |
3.1 AnMBR purification performance
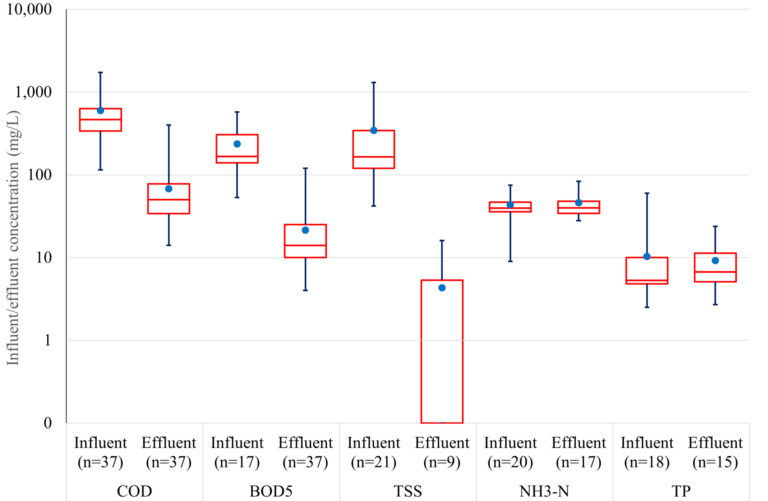
The 50 systems captured demonstrate significant variability in the ranges of pollutant removal efficacy across the various parameters (Fig. 1), as well as differences in the reference parameters selected.
3.1.1 Total suspended solids
Two studies reported relatively high effluent TSS concentrations of 16 (NGS-T1) and 15 mg/L (GS-T1). These unusual values, which would prevent the effluent being used for a number of purposes, were attributed to biofilm growth on the permeate pipe walls, so can be considered anomalies. All other systems report permeate TSS concentrations below the stated permitted limits for every reuse purpose, with five reporting non-detectable permeate TSS and GS-H9 and GS-H13 reporting 5.33 and 2 mg/L respectively.
3.1.2 Pathogens
Very few of these studies reported pathogen concentrations, although those that had (GS-F1 and GS-H12) recorded mean faecal coliforms levels below 50 CFU/100 mL. This would be sufficient to meet the 200 CFU/100 mL stipulated for some agricultural uses (except the non-detectable limit required for the irrigation of raw consumed food crops) and for industrial reuse, but not for toilet flushing or street cleaning and fire-fighting where supplementary chemical disinfection would be required.
3.1.3 Nutrients
Since AnMBRs do not remove nutrients reported effluent NH3-N concentrations are generally high, ranging from 28 to 83.2 mg/L. TP concentrations range from 2.7 to 23.8 mg/L. None of the AnMBR systems could directly produce an effluent satisfying the NH3-N and TP consents stipulated in the Chinese reuse standards. However, the lack of nutrient removal may not preclude the reuse of the permeate water for agricultural and landscape irrigation. The clarification provided by the AnMBR technology would be expected to expedite the recovery of the nutrients in relatively pure form for reuse as chemical fertilisers.
3.1.4 Organic matter
Overall organic matter removal across all studies where data is available is summarised in Figure 2, together with the BOD5 limits taken from the various NPR standards. With reference to the BOD5 limit of the NPR reuse standards listed in Tables 1a−1g, there are 32, 31 and 30 of the 37 systems which could respectively meet the BOD5 limit of 35, 30 and 25 mg/L with no further treatment required. The consents of 20 and 15 mg/L, where most standards for agricultural irrigation lie, can be met by 24 and 22 systems respectively, and 12 systems are able to meet the consent of 10 mg/L − which includes direct human contact reuse applications. Finally, six systems meet the strictest BOD5 limit of 6 mg/L for non-potable reuse purposes in all standards.
Only the EU and Chinese standards have a COD consent. Agricultural reuse has the most wide-ranging limit for different purposes; 33 systems satisfy the EU’s COD limit of 125 mg/L for agricultural irrigation (except where raw consumed food crops are involved). There are 30 and 13 AnMBRs that can respectively satisfy the COD limit set by the Chinese agricultural reuse standards of 90 mg/L for farming and forestry and 40 mg/L for animal husbandry (Table 1d). Overall these results show that, despite the wide variability in effluent quality reported across the different studies, AnMBRs can apparently be operated to ultimately meet the organics limit for any non-potable reuse standard.
3.2 Impact of operational variables and system characteristics
A review of the COD removal rate vs. the anti-fouling strategy (Fig. 3) and installed membrane configuration (Fig. 4) respectively indicate that neither influence organic removal. Counter-intuitively, COD removal appears to slightly decrease with decreasing membrane pore size, according to the data based on the same hollow fibre configuration.
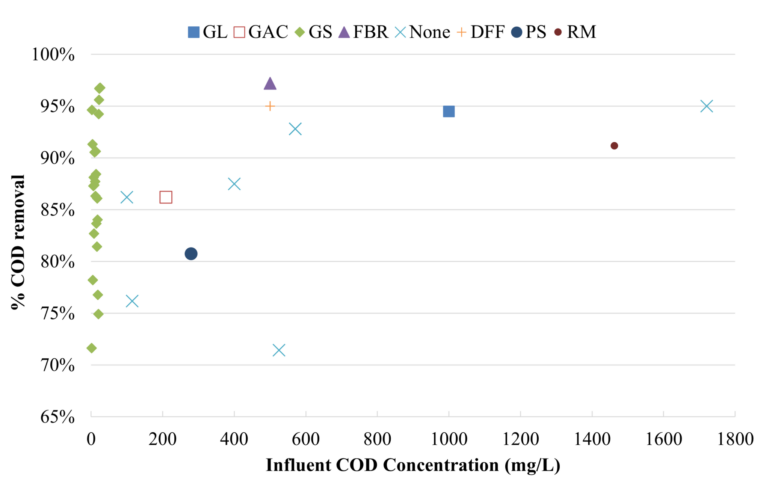
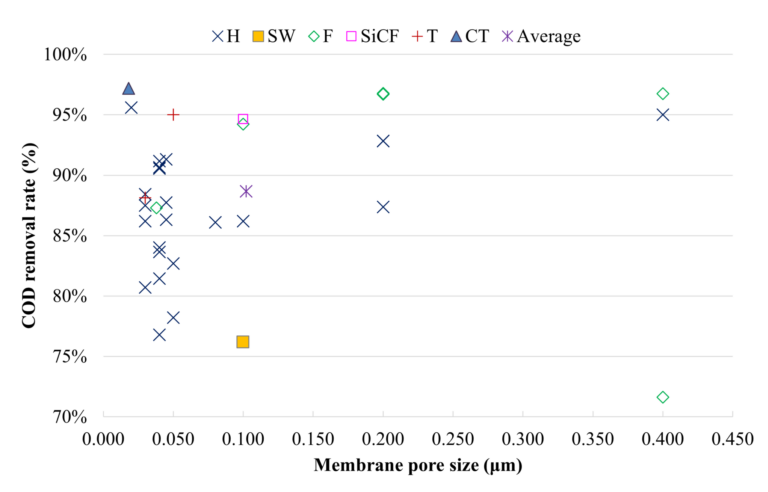
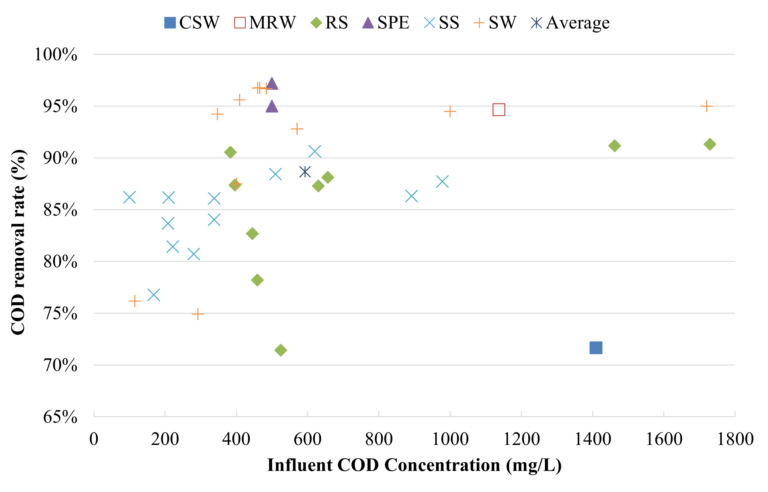
There is a faintly discernible trend of increasing %removal with increasing COD concentration (Figs. 4 and 5), as expected from basic equilibrium thermodynamics. The lowest COD effluent concentrations were generally recorded for synthetic wastewater (Fig. 5), possibly reflecting their increased biodegradability (BOD/COD = 0.5−0.7) compared with real wastewaters (BOD/COD = 0.3−0.5).
Most systems reviewed operated with an HRT of 4 to 12 h, with the average being around 8 h. As with other correlations, there was no apparent relationship between COD removal and HRT across all studies, although HRTs longer than 15 h appeared to offer more predictable performance – 84% removal or more. Against this, a principal component analysis suggested a clear link between HRT and methane yield.
Overall it is not clear as to whether a specific membrane material/configuration, process configurationAugsburger or process operation conditions can offer a significant improvement in performance with respect to COD removal and product water quality. Overall the permeate quality attained nonetheless meets water quality objectives for most reuse applications.
Energy recovery efficiency is affected by the same factors as for classical anaerobic treatment. It is known that biogas produced by AnMBRs contains >70% methane, the yield increasing linearly with organic loading rate. Up to 98% of the influent COD can be converted into biogas − equivalent to seven times the energy required for system operation. In practice, however, actual biogas yields are limited both by the high solubility of CH4 in water (22.7 mg/L at 20°C), a significant loss for low-strength feedwaters, and process limitations caused by inhibitory substances such as sulphate. As with classical anaerobic treatment, AnMBRs are generally more viable for warmer climates.
A number of post-treatment options have been trialled for AnMBR permeate (Table 6). These have variously targeted:
- Removal of trace organic matter, including biorefractory micropollutants, using activated carbon (Mai et al., 2018)
- Advanced oxidation of micropollutants in the presence of ammonia (Augsburger et al., 2021)
- Removal of organic and inorganic residuals using nanofiltration (Wei et al., 2015) or reverse osmosis membranes (Mamo et al, 2018)
- Extraction of dissolved methane and/or ammonia using membrane contactors (Rongwong et al., 2019; Song et al., 2018b)
- Capture of nutrients for their reuse using ion exchange processes (Huang et al., 2020; Liu et al., 2016)
- Removal of nutrients using algal photobioreactors (Ruiz-Martinez et al., 2012)
- Precipitation of phosphate by coagulant dosing (Penetra et al., 1999)
| Technology | Target component & % removal | Advantages | Disadvantages | Reference(s) |
|---|---|---|---|---|
GAC Granular activated carbon; PAC Powdered activated carbon; VOC Volatile organic compounds; PhCs Pharmaceutical compounds; DOC Dissolved organic carbon; AOCs Aromatic organic compounds; NOM Natural organic matter; AC Activated carbon; MW Molecular weight; EDs Endocrine disruptors; PCPs Personal care products; MD Membrane distillation; NF Nanofiltration membrane; FO Forward osmosis membrane; RO Reverse osmosis membrane; IEX Ion-exchange; TKN Total Kjeldahl nitrogen; OMPs Organic micropollutants; AOP Advanced oxidation process; IEX Ion exchange; HAIX Hybrid anion exchange; HRT Hydraulic retention time | ||||
| GAC | 80% COD, Phenols; VOC; PhCs; Metals; EDs; PCPs | Wide targeting range, easy to apply, low cost, effective elimination of PhCs, EDs and PCPs | Limited adsorption of low MW compounds | Mai et al., 2018; Nguyen et al., 2012; Snyder et al., 2007; Trzcinski et al., 2011; Vyrides et al., 2010 |
| PAC | 84% COD; Phenols; 80% DOC; VOC; PhCs; Metals; EDs; PCPs | Wide targeting range, effective removal of traces of organic carbon, effective elimination of PhCs, EDs and PCPs | Limited adsorption of low MW compounds | See above |
| Carbon Nanotubes | COD; Phenols; VOC; PhCs; Metals; AOCs; NOM; EDs; PCPs | Wide targeting range, no diffusion required compared to AC, effectively eliminate PhCs, EDs and PCPs | High manufacturing cost | Amin et al., 2014 |
| MD | 98% COD; 10% NH4+; >99% PO43−; 65% dissolved methane; 76− 100% OMPs | Complementary performance with AnMBR for energy and water recovery | Flux strongly depends on the temperature and pressure, require further treatment for TN | Jacob et al., 2015; Kim et al., 2015; Song et al., 2018b; Xie et al., 2016 |
| NF | COD; NH4+; Up to 95% PO43−; Multivalent ions; 80−92% OMPs | Produces high quality effluent for reuse | Lower energy demand than RO, effluent contains monovalent ions | Wei et al., 2015 |
| RO | 88% COD; >99%TOC; 91% TKN; 99% PO43−; Multivalent ions; Monovalent ions; >90% OMPs | Produces very high quality effluent with almost complete removal of organics and nutrients | Very high energy demand, limited removal on hydrophilic organics with low MWs | Grundestam & Hellström, 2007; Gu et al., 2019; Liu et al., 2020 |
| Microalgae | 67% NH4+; 98% PO43−; COD; 0−8% OMPs | Suitable for high quality effluent from AnMBR, Generated biomass could be used to generate renewable biofuel | Need optimum operation condition, poor removal on OMPs | Ruiz-Martinez et al., 2012; Wu et al., 2022 |
| IEX (Zeolites); IEX (HAIX) | 83−94% NH4+; 97% PO43− (PhosXnp) | Selectively removal and recovery of nutrients, short contact time, low footprint | Regeneration dominates operational cost and energy consumption | Deng et al., 2014; Sendrowski & Boyer, 2013 |
| Coagulation-Flocculation (FeCl3) | 96% PO43− | Widely applied to Aerobic system for enhanced chemical phosphorus removal | Produces excess solids waste | Penetra et al., 1999 |
| Membrane Contactor | 98.9% Dissolved Methane; 90% NH4+; Up to 100% OMPs | High methane and ammonium recovery | Membrane fouling and wetting, economic viability unclear, requires further treatment for TP | Christiaens et al., 2019; Cookney et al., 2016; Rongwong et al., 2019 |
| Membrane biofilm reactor | 96% NH4+; 98% dissolved methane; 90% nonpolar, hydrophobic and hydrophilic OMPs; 22–69% negatively charged and acidic OMPs | Can remove both dissolved methane and TN | Require both energy and membrane cost, also further treatment for TP | Chen et al., 2015; Sanchez-Huerta et al., 2022 |
4. Conclusions
Outcomes from a wide range of predominantly bench-scale studies suggest that AnMBRs can produce effluent from municipal wastewater feeds satisfying most consents for non-potable reuse, other than for certain applications where limits on nutrient concentrations are imposed. AnMBRs provide a clarified effluent which permits simpler and more effective nutrient recovery, removal/destruction of residual dissolved organics and/or purification by dense membrane processes such as nanofiltration or reverse osmosis. Against this, the extraction of the residual dissolved methane, which can potentially make up a significant proportion of the latent energy from the original organic carbon, presents a significant challenge. Despite this, there is clearly scope for improving the effectiveness of the process through the further development of both the biological process and membrane configurations.


