Non-sewered sanitation with the NEWgenerator - a solar powered anaerobic MBR

Robert Bair, Hsiang-Yang Shyu and Cynthia Castro
Department of Civil and Environmental Engineering, University of South Florida, USA. Email: [email protected]
1. Introduction
In the developed world, a safe drinking water supply and flushing toilets are taken for granted. But for around 4.2 billion people worldwide in low- and middle-income countries safe sanitation is not easily attainable. Communities beyond the reaches of sewer networks served by centralized wastewater (WW) treatment works are effectively left to fend for themselves.
In 2011, the Bill and Melinda Gates Foundation (BMGF) spurred the development of advanced decentralized sanitation technologies by launching the Reinvent The Toilet Challenge (RTTC). The RTTC aims to develop a toilet that can treat waste at the point of generation at less than 5 US cents per user per day without relying on traditional water and electricity grids. Through funding provided by this initiative, the University of South Florida (USF) developed the NEWgeneratorTM (NG).
The NG system aims to provide safe sanitation as well recover nutrients, energy, and water from the sewage, and has an anaerobic sidestream membrane bioreactor (AnsMBR) at its core with downstream electrochlorination (EC). It is a fully-integrated system housed in a mini-shipping container operating entirely on photovoltaic power. It has previously been tested at a primary school in southern India for one year.
This feature summarizes the findings from a subsequent long-term field trial of the updated (v2.0) technology at an informal settlement community in eThekwini Municipality, KwaZulu-Natal Province, South Africa. The unit was challenged with two different types of high-strength WW and operated under wide-ranging and fluctuating environmental and usage conditions, including periods of dormancy.
2. The NEWgenerator v2.0 system
The v2.0 (Fig. 1) was fitted with a nutrient capture system (NCS) designed to passively remove nitrogen as ammonium using cation ion-exchange media and granular activated carbon (GAC). The NCS was installed downstream of the AnsMBR and before the final EC disinfection stage. The unit was protected by a 20 mm coarse bar screen and a 2.5 m3 (2.0 m3 working liquid volume) underground equalization (EQ) tank, providing a residence time of 3.8 d at an average daily blackwater flow of 530 L/d.
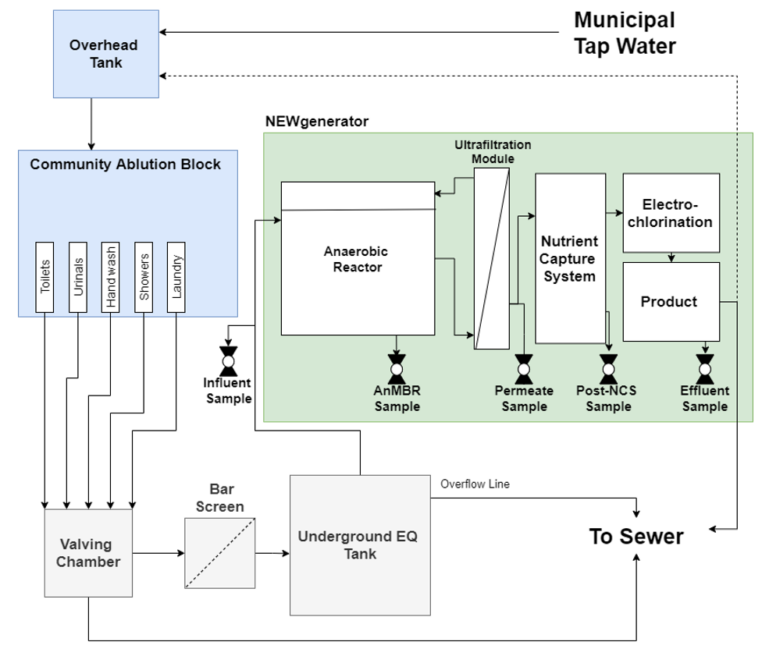
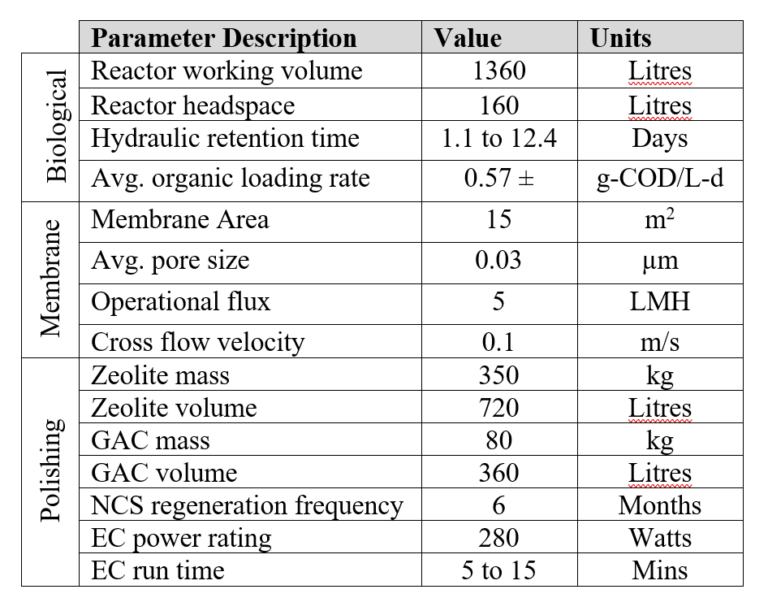
The three-chamber AnsMBR baffled reactor was an attached growth configuration, using a coarse polypropylene mesh suspended 1.5 m above the chamber floor in the first two chambers. It had a working liquid volume of 1360 L and a headspace of 160 L, and was designed to treat up to 1000 L/day. The third chamber was recirculated to an external 15 m2 PVDF multitube ultrafiltration (UF, 0.03 µm pore size) module (Pentair). The membrane was operated under very conservative conditions (~5 LMH at a crossflow velocity of 0.1 m/s), with automated relaxation and backwashing, to minimize manual maintenance requirements. Chemical cleaning was triggered at a TMP of ~0.75 bar.
The AnsMBR permeate was fed to an EQ tank and on to the NCS, which comprised three 360 L tanks in series through which the permeate flowed upwards. The first two tanks contained a combined total of 350 kg clinoptilolite zeolite of 0.85−2 mm grain size, followed by a third tank filled with 80 kg of GAC for polishing. Both the zeolite and GAC media were locally sourced and pre-washed before use.
The NCS effluent entered a final EQ tank from where it was fed to a 56 L chlorination contact tank operated as a batch process using electrolytically generated chlorine from a commercial EC cell (M100 model, WaterStep). The EC was fed by a brine solution and the chlorine gas generated dissolved and hydrolyzed to hypochlorous acid (HOCl) in the chlorination tank. The chloralkaline cell was thus not in direct contact with the WW, minimizing electrode fouling and scaling. The chlorination cycle duration was dictated by the measured oxidation reduction potential (ORP) of the water being processed. On reaching the ORP set point, the chlorinated water was released to a product water storage tank.
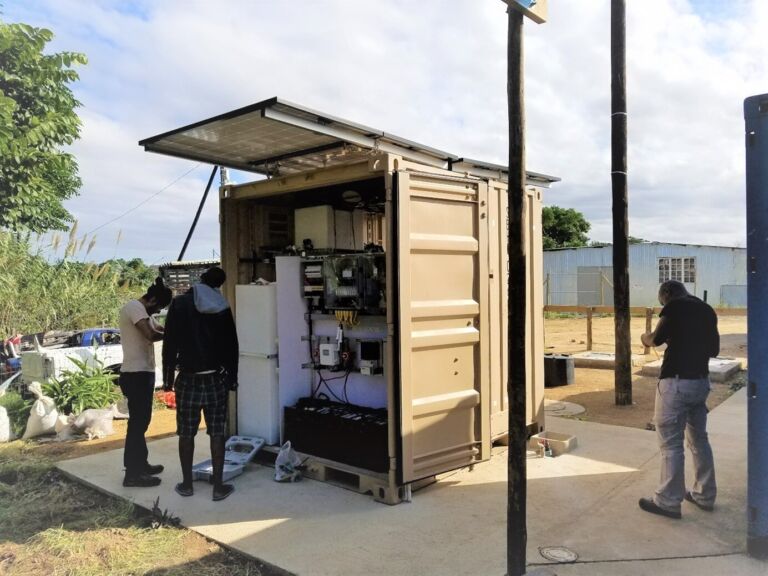
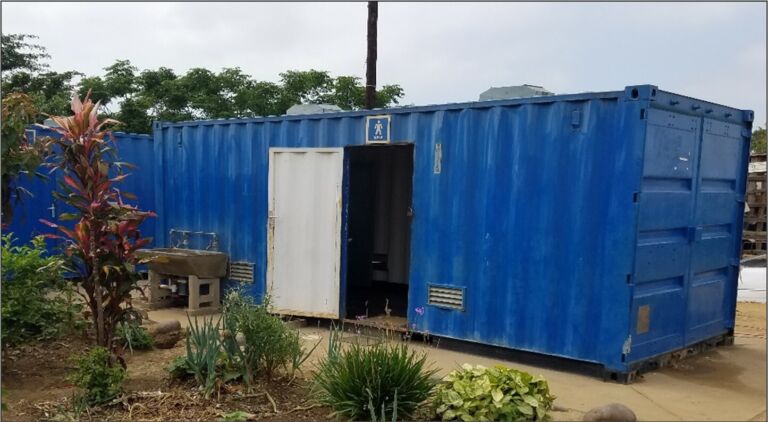
The system, built at the University of South Florida (USF) in Tampa, was housed in a mini shipping container (Fig. 2) and placed next to the community ablution block (CAB, Fig. 3). Electrical power was generated by four solar panels mounted to the container roof, the combined rated capacity being 1.16 kW, and stored in a 14.7 kWh battery bank. Automation and control was provided by an Arduino microcontroller operating the pumps and valves in response to level sensors in their respective tanks.
3. The test programme
The NG system was connected to one of the male CABs, comprising three toilets, two urinals, two showers, two handwash sinks, and two laundry basins. The valving allowed the WW sources (i.e., sinks, showers, toilets, urinals, and laundry) to be individually sent to the NG system or bypassed to the sewer, depending on the desired testing requirements.
The AnsMBR was seeded with 150L anaerobic sludge from a regional municipal mesophilic anaerobic digester and operated at a reduced flow rate of 250 L/d for 60 days to allow acclimatization. It was then run for 534 d (458 d operational and 76 d dormant) and challenged with two different WWs from the CAB: toilet effluent (or black water, BW), and combined toilet and urinal effluent, or yellow water (YW). The air temperature ranged from 13.8 C to 34.0 C across the entire test period, which comprised three stages (Table 1) of which the first two encompassed shutdown and/or maintenance (including regeneration of the NCS bed).
| Stage | Water source / event | Start date | End date | Duration, days |
|---|---|---|---|---|
BW: Black water | ||||
| BW | 01-10-2018 | 12-12-2018 | 73 | |
| Stage A | Holiday shutdown | 13-12-2018 | 06-01-2019 | 25 |
| BW | 07-01-2019 | 16-04-2019 | 100 | |
| BW + YW | 17-04-2019 | 12-08-2019 | 118 | |
| Stage B | Regenerate | 13-08-2019 | 19-08-2019 | 7 |
| BW + YW | 20-08-2019 | 08-12-2019 | 111 | |
| Regenerate + Maintain + Holiday shutdown | 09-12-2019 | 21-01-2020 | 44 | |
| Stage C | BW | 22-01-2020 | 17-03-2020 | 56 |
Samples were taken from five locations along the treatment train (Fig. 1). The range of influent and effluent characteristics are shown in Table 2, which also indicates the extent to which the local water company (eThekwini Water and Sanitation) and ISO treated effluent water standards were met overall.
| Parameter | Influent | Effluent | % red. | eWS (av/mx) | met? | ISO 30500 | met? |
|---|---|---|---|---|---|---|---|
eWS and ISO 30500 refer to eThekwini Water and Sanitation and ISO effluent standards | |||||||
| TSS (mg/L) | 651.8 ± 391.9 | 10.3 ± 10.2 | 97.6 ± 3.1 | 10/30 | √√ | 10/30 (Cat A/B) | √√ |
| COD (mg/L) | 2419.5 ± 967.2 | 117.7 ± 90.8 | 94.5 ± 5 | 50/150 | √ | 50/150 (Cat A/B) | √ |
| pH | 6.8 ± 0.5 | 7.5 ± 0.8 | - | 6-9 | √√ | 6-9 | √√ |
| Turbidity (NTU) | 966.5 ± 612.0 | 35.8 ± 92.4 | 96.3 ± 9.7 | 5/10 | √ | - | |
| Color (Pt/Co) | 1908.1 ± 1104.9 | 155.6 ± 266.6 | 92.0 ± 10.5 | - | - | ||
| E. coli (CFU/L) | 1.0 x 10⁷ ± 2.5 x 10⁷ | 0 ± 0 | 7.4 ± 1.5 (LRV) | <100 CFU/L | √√ | > 6 (LRV) | √√ |
| Helminths (counts/L) | 22 ± 35 | 0 ± 0 | - | - | > 4 (LRV) | √√ | |
| Residual FCl (mg/L) | - | 7.9 ± 13.6 | - | > 0.5 | √√ | - | |
| TN (mg/L) | 279.7 ± 94.4 | 68.9 ± 90.1 | 82.1 ± 24.0 | - | 70% red. | √ | |
| TP (mg/L) | 74.4 ± 50.0 | 41.1 ± 19.3 | 43.0 ± 22.1 | - | 80% red. | × | |
The BW was 5−10 times stronger than typical municipal WW in terms of TSS, COD, turbidity, color, TN, and TP concentrations due to the absence of dilution by greywater. Since the urinals did not use flush water, the YW was ~100% urine. Accordingly, the YW contributed additional COD and nutrients to the WW influent with negligible dilution.
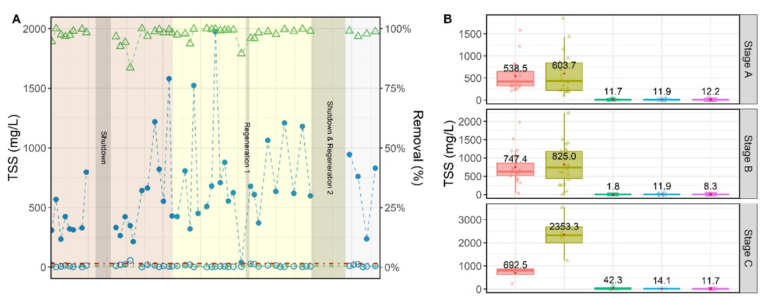
Mean COD, TSS, and TP concentrations in the WW did not therefore vary significantly between the three stages, though there was substantial variability between samples. An increase in influent constituent levels was observed during Stage A, which stabilized during Stage B. Some of this increase can be attributed to solids accumulation in the underground EQ tank and their subsequent solubilization. This was more evident for Stage A, due to the increased holiday and maintenance shutdown periods compared to the other stages. Overall, about 50 to 60% of the total influent COD was soluble.
4. Results
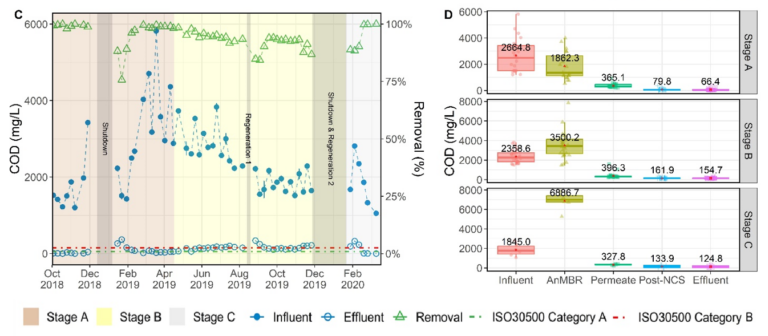
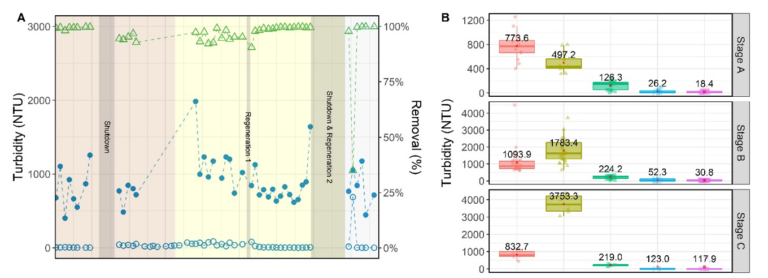
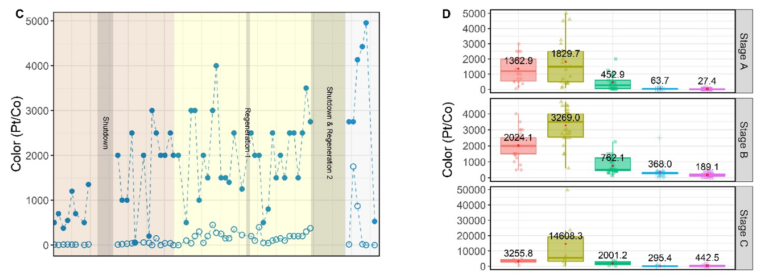
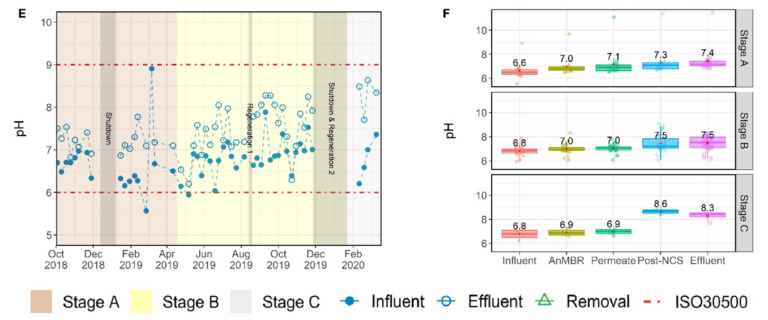
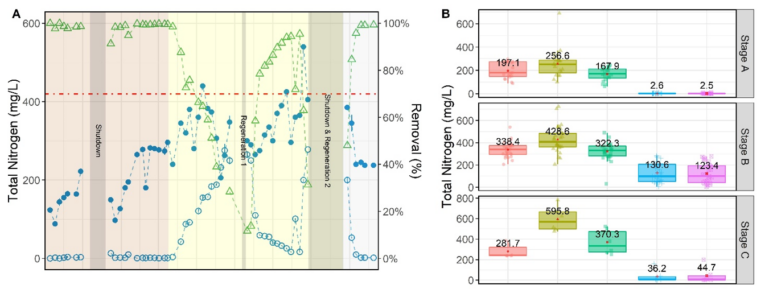
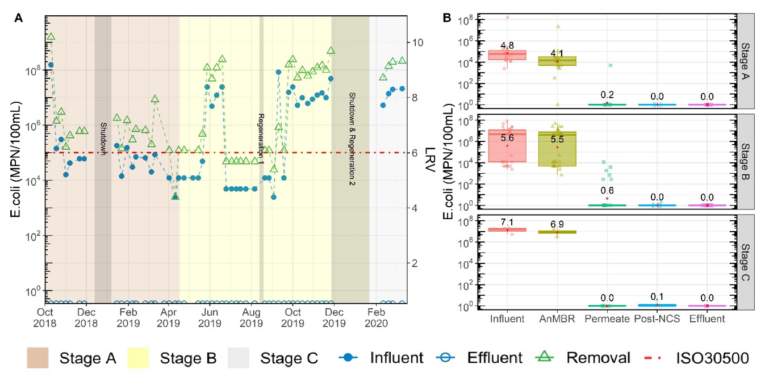
The performance of the unit at each stage is depicted in Figures 4−7 for TSS and COD (Fig. 4), turbidity, color and pH (Fig. 5), the nutrients TN & TP (Fig. 6), and the indicator pathogen E. coli (Fig. 7). For each figure the lines within the box of the box plots (B & D) indicate median values, the red dots and the number shown in the box the mean, and the box lower and upper lines the 25th and 75th percentile values respectively.
4.1 COD, TSS, color, turbidity and pH
Data for the temporal and summary water quality parameters for suspended solids and organic matter removal (Figs. 4−5) indicate the extent of removal by the UF membrane (Fig. 4−5 B & D), equating to 97.0 ± 9.8% TSS, 82.1 ± 11.9% COD, and 78.1 ± 12.1% turbidity regardless of influent WW quality. A few sporadically high values recorded during Stage C were attributed to chemical precipitation of inorganics through oxidative chlorination.
Since no sludge was wasted over the entire test period, recalcitrant organic matter gradually accumulated in the AnsMBR. However, this did not appear to affect the performance of the UF membrane which provided relatively constant permeate concentrations. This suggests that annual desludging should be sufficient for maintenance.
During normal operation COD removal was 94.5 ± 5.0%, decreasing the concentration from 2420 ± 967 mg/L influent down to an average of 118 ± 91 mg/L ignoring the periods following dormancy events. The majority of the COD removal occurred in the AnsMBR (Fig. 4D). The GAC in the NCS further removed ~200 mg/L of the permeate COD. During Stage B, the COD removal gradually deteriorated due to exhaustion of the GAC bed. On replacing the GAC bed near the start of Stage C the COD removal returned to >95%. Spiking of COD effluent levels was observed following start up after dormancy periods, most likely due to biofilm sloughing off the NCS media (since no similar spiking was observed in the AnsMBR permeate).
Color decreased from 1908 ± 1105 Pt/Co in the influent down to 156 ± 267 Pt/Co in the treated effluent, with a corresponding average removal of 92.0 ± 10.5% − similar to the COD trend. Spikes in color were similarly observed following dormancy periods. A further reduction to an average of 6.7 ± 11.5 Pt/Co was observed following GAC media replacement.
The pH increased slightly as a result of the treatment, but did not exceed the maximum ISO 30500 value of 9. Over the entire period, the average product water pH was 7.5 ± 0.8 (Fig. 5F).
The HRT of the AnsMBR fluctuated between 1.1 d and 12.4 d and the organic loading rate (OLR) 0.57 ± 0.47 g-COD/L-d on average across the whole campaign. This is lower than OLRs normally associated with anaerobic treatment – which can be as high as 15 g-COD/L-d before the biological consortia are negatively affected.
4.2 Nutrients
The NCS was designed primarily for TN removal, with only incidental TP removal by complexation or precipitation. 98.5 ± 2.1% mean TN removal was recorded during Stage A, exceeding the ISO requirement. During Stage B, the influent TN steadily increased, fluctuating between 300 and 400 mg/L following addition of YW (Fig. 6A), such that the mean influent TN was ~1.8 times higher in Stage B than in Stage A (Fig. 6B). TN removal subsequently dropped below 70% (67.6 ± 25.7 % on average) as the zeolite beds became exhausted (Fig. 6). During Stage C, when YW was excluded, influent TN commensurately decreased. Following NCS regeneration the target of 70% TN reduction was again met (87.7 ± 20.2 % removal). The overall mean TN removal was 82.1 ± 24.0 %, with the ISO 30500 TN removal standard being met 67.2% of the time.
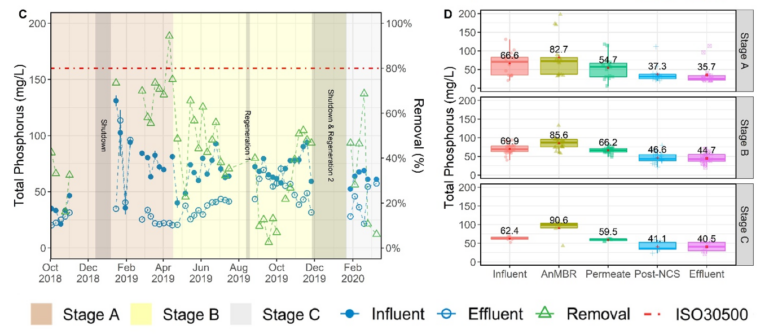
As with the TN trends, the influent TP increased during Stage A, specifically after the December 2018 shutdown (Fig. 6C). The influent TP increased to an average of 85.6 ± 83.8 mg/L on startup in 2019, then dropped to 69.9 ± 12.6 mg/L during Stage B and 62.4 ± 5.9 mg/L in Stage C. TP removal for the three stages was 58.7 ± 21.9%, 36.9 ± 18.0%, and 34.4 ± 24.0 %, respectively, 43.0 ± 22.1 % overall, well below the 80% ISO 30500 threshold.
The gradual increase in TN and TP within the AnsMBR over the entire test period mirrored the trend for COD and TSS, suggesting accumulation of organically-bound nitrogen and phosphorus within the reactor (Fig. 6B,D). As with the COD, selective permeation by the membrane reduced TN from 383.5 ± 163.2 mg-N/L in the bioreactor down to 269.5 ± 111.9 mg-N/L in the permeate.
The NCS further decreased the TN concentrations down to as low as 2.6 ± 2.6 mg-N/L during Stage A, effectively removing most of the incoming TN until breakthrough following 6 months of operation. The zeolite beds were regenerated twice during Stage B (Aug 2019 and Dec 2019), restoring capacity and providing TN removal efficiency >90%. The downstream GAC bed was replaced on 18 February 2020 during Stage C.
4.3 Pathogens
Over the course of the study, no helminth ova (Ascaris suum) were found in the final effluent (Table 2) despite being detected in the influent, as would be expected given the pathogen size compared to the UF pore size. A mean log removal value (LRV) of 7.4 ± 1.5 was recorded for E. coli, the mean influent concentration being 1.0 x 10⁷ ± 2.5 x 10⁷ MPN/100mL and non detectable (<1 MPN/100mL) in the final effluent. The membrane accounted for 6.7 ± 2.6 LRV, whilst chlorination (generating 7.9 ± 13.6 mg/L of residual free chlorine on average) further reduced the residual pathogen levels down to non-detectable.
4.4 Water production and membrane permeability
The system produced 332 ± 214 L/d of treated effluent on average during the three stages of operation, compared with a design capacity of 1000 L/d. Since the EC was operated as a batch process of 15−50 minute cycles, due to issues with malfunctioning power supply and reduced post-NCS water quality, it often became the rate limiting step for production. Exhaustion of the NCS increased the chlorine demand. Replacing the EC power supply increased the system capacity.
The membrane transmembrane pressure (TMP) remained below 0.5 bar during the first half of Stage A before increasing to above this threshold for the second half of the stage. This was likely due to minor fouling of the membrane. The TMP remained stable at around 0.5 bar from February to September of 2019, with occasional spikes from manual increases in the permeate production rate for troubleshooting purposes. On returning the flux to the design rate of 5 LMH, the TMP returned to ~0.5 bar.
After September 2019, the TMP exceeded 0.75 bar, and a chemical cleaning subsequently initiated on 12 November 2019, but did not sustainably recover the TMP. A more thorough chemical clean, with increased water rinsing prior to bleach cleaning, was conducted prior to Stage C which successfully returned the TMP to below 0.5 bar.
5. Summary and conclusions
An off-grid self-contained wastewater treatment system for use in informal settlements has been tested over an 18-month period. The system, the NEWgenerator (NG) was based on an anaerobic sidestream MBR (AnsMBR) with downstream media beds of zeolite-based ion cationic exchange, ostensibly for ammoniacal nitrogen removal (hence the nutrient capture system, NCS), and GAC polishing. Final disinfection was by electrochlorination. The entire facility was powered by photovoltaic cells mounted on the roof of the facility.
The NG system met and exceeded the ISO 30500 treated water quality standards for E.coli and nitrogen removal and those for discharge and category B reuse, and met the local regulatory standard of >0.5 mg/L for the chlorine residual.
It was able to meet the ISO 30500 Category B and eWS standards for TSS and COD 81% and 62% of the time respectively. The local regulatory standard for turbidity of <10 NTU was not often met, the average being 36 ± 92 NTU across the entire campaign. The ISO 30500 TP standard of 80% removal was also not met as the system was not designed to address this.
The noted constraint on flow capacity was observed to be primarily due to the electrochlorination device, which could be addressed through 100% redundancy (i.e. installing duty + standby units). The AnsMBR could otherwise sustain a flux of 5 LMH with minimal cleaning, required to limit maintenance requirements.
The limitation on ultimate treated water quality was attributable to the media bed capacity. The campaign outcomes suggest the NCS would require regenerating and the GAC bed replacing every 6 months-or-so for this application (Table 3). However, GAC bed life is dependent on COD loading, such that monitoring of the COD through an inexpensive surrogate parameter, in this instance color, would provide a more accurate indicator of bed life. Also, start-up after periods of dormancy always lead to elevated levels of COD and TSS in the treated water.
The work on the development of the NEWgenerator system is ongoing, with other R&D groups worldwide developing their own systems to meet the RTTC. The trial conducted at the rural location in South Africa suggests that an approach based on an inherently low-energy, low-maintenance process, allowing it to be sustained by solar power, may provide a viable solution to a global problem.


