2019 Wastewater treatment survey – the results


Simon Judd1 and Claire Judd2
1Professor of Membrane Technology; 2Manager of The MBR Site
If you're a regular visitor to The MBR Site, you'll be aware that we've carried out a number of short surveys over the last few years. This year, we widened the question to beyond just MBRs. So this time, we asked the question: What influences the selection of wastewater treatment technologies for water reuse?
Please find the outcomes of our 2019 survey below.
1. Introduction
Our 2019 survey was rather different from our preceding surveys − this time the subject was not MBRs, but wastewater treatment in general. The purpose was to try and establish what features or attributes of a process technology are considered to be the most important with reference to its selection for wastewater treatment duties.
The survey was conducted using SurveyMonkey during the period February−April 2019, and potential respondents were encouraged to engage via the LinkedIn networking platform. The survey was announced on most of the 24-or-so water related groups on LinkedIn.
We received 65 responses in total, of which 57 were usable: a key condition of the survey was that both the 'rating' question (Q.1) and the 'ranking' question (Q.4) had to be answered in full. These questions were identical, the key difference being that Question 1 required respondents to rate the importance of the technology aspect out of a maximum score of 10 whereas Question 4 required these aspects to be ranked in order of importance.
You can read the survey questions in Annex 1 below.
2. How the data was processed
Since different respondents will assign different absolute values to a qualitative parameter like 'importance', the data were all normalised to give relative values for both the rating and the ranking data, where:
The 'relative value' is therefore given as a percentage, where 100% is assigned to the most highly rated or ranked response and 0% to the least. This is more appropriate than the absolute values which, in the case of the rating data, lie within a fairly narrow range.
For the ranking data from Q.4 the 'value' term in the numerator is given by 'value = 6 − ranking'. The above equation then yields a relative value which increases with increasing ranking in the same way as the relative rating value from Q.1. So, a high value is associated with increased importance.
3. Respondents
The survey originally identified five different groups of stakeholders (or 'cohorts'), these being:
- OEM/Technology supplier
- Water company employee
- Consultant
- Contractor and
- Academic.
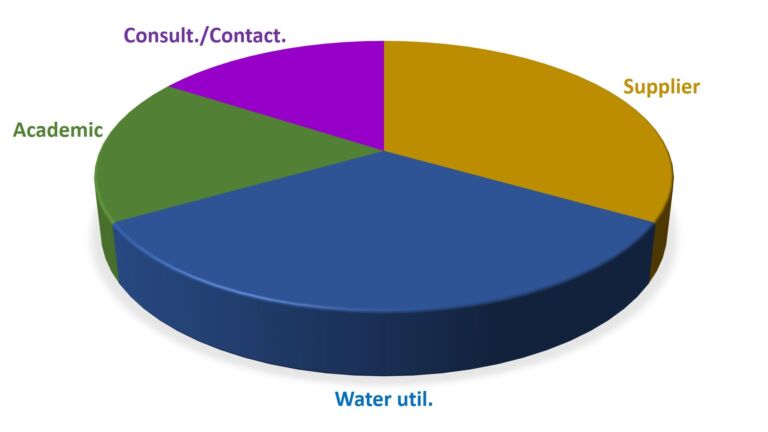
The respondents were predominantly from the 'OEM/Technology supplier' and 'Water company employee' cohorts (Fig 1).
Some re-categorising of respondents who had placed themselves in the 'Other' cohort was necessary. This affected four responses in total. Also, in order to provide a reasonably statistically significant number within each cohort, the 'Consultant' and 'Contractor' cohorts were combined. This then yielded nine respondents in this cohort, with 10 in the 'Academic' cohort and 19 each in the remaining two cohorts.
4. Survey outcomes
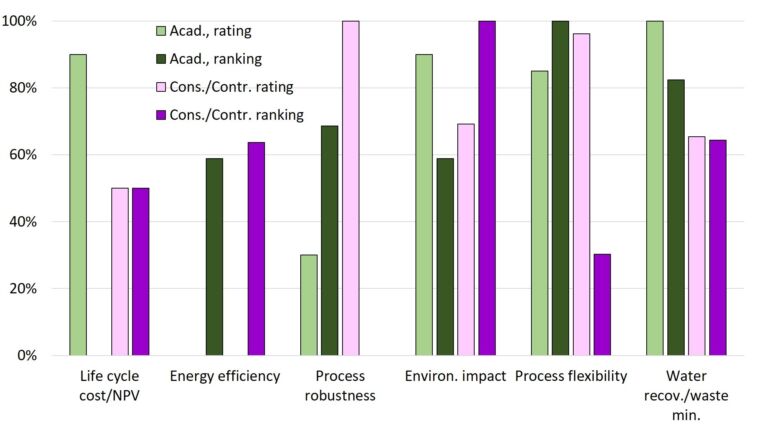
The outcomes for the 'Technology suppliers' vs 'Water company employees', and the 'Academics' vs the 'Consultants/Contractors' are given in Figures 2 and 3 respectively and indicate some interesting trends.
Firstly, comparing the 'rating' and 'ranking' responses reveals that there is greater consistency between these pairs of data for 'Technology suppliers' and 'Water company employees' (Fig. 2) than there is for 'Academics' and the 'Consultants/Contractors' (Fig. 3).
For example, in Fig. 2, NPV*/Life cycle cost is both rated and ranked at 90−100% on average by both cohorts, and Water reuse/waste minimisation ranked 0−22% on average. The average disparity between the rating and the ranking is 21% for the 'Suppliers' and 17% for the 'Water utility employee' cohorts.
Compare this with the responses from the 'Academics' and 'Consultant/Contractors', where very significant differences were evident between the rated and ranked data. For example, the 'Academic' cohort rated NPV/Life cycle cost at 90% on average and 0% when ranked. Energy efficiency was rated and ranked at 0% and 59−64% respectively by both the 'Academic' and 'Consultant/Contractor' cohorts. The average disparity between the rating and the ranking is 47% for the 'Academics' and 52% for the 'Consultant/Contractors' − more than double the corresponding figures for the other two cohorts.
*NPV: Net present value
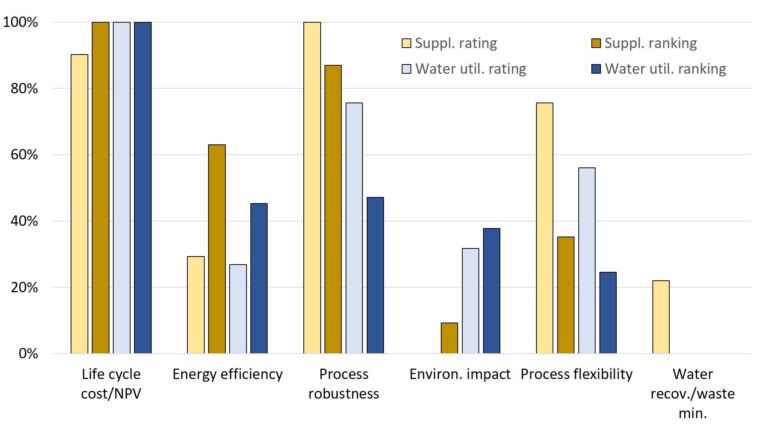
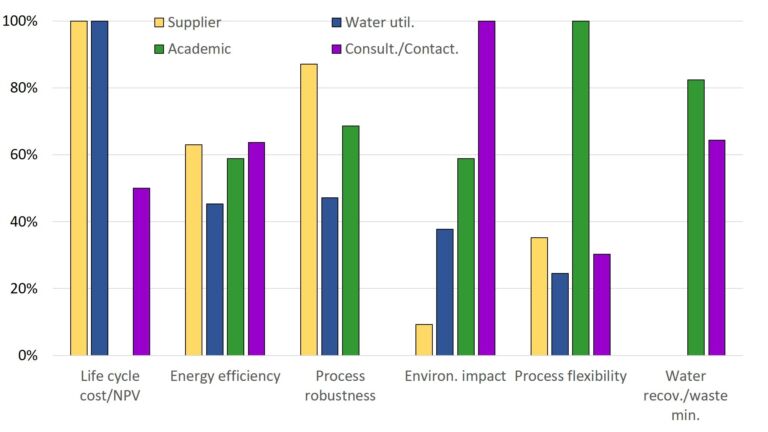
Secondly, a comparison of the overall ranking data across all four cohorts (Fig. 4) suggests that, in general, the 'Suppliers' and 'Water utility employees' place the greatest emphasis on NPV/Life cycle cost and Process robustness. Energy efficiency is also identified as being quite important − presumably due to its direct relation to operating expenditure (OPEX).
Against this, Water recovery/waste minimisation is ranked the lowest by both these cohorts, and both Environmental Impact and Process flexibility are ranked below 40% by both these cohorts.
Different trends are evident from the 'Academic' and 'Consultant/Contractor' cohort data. For the 'Academic' cohort, both Process flexibility and Water recovery/waste minimisation are ranked above 82%, with Environmental Impact at almost 60% and, conversely, NPV/Life cycle cost at 0%. For the 'Consultant/Contractor' cohort the highest ranked aspect is Environmental Impact.
5. Conclusions
It's important to take care when interpreting data from surveys of this sort. The number of respondents is small − fewer than 20 in each of the cohorts. For a cohort of fewer than 10, a significant change in the calculated percentage figures can arise from a single anomalous entry.
Against this, the inconsistency between the rating and ranking data has been noted in a previous survey conducted by the Gas Processing Center at Qatar University in 2018, based on the same questions and directed at produced water treatment stakeholders. Interestingly, in that survey, the rating vs. ranking inconsistency was also greatest for the 'Consultant' cohort, and for a much larger cohort. However, this perhaps reflects as much on the close relationship between some of the aspects as anything else, and whether these are causal. It could, for example, be argued that the cost of a process is directly linked to the requirement to reduce the environmental impact (i.e. the purity) of the treated effluent.
It might have been expected that the trends in the 'rating' and 'ranking' data would be the same, which is clearly not the case within each cohort. Having said this, the top two technology aspects are the same for both the rated and the ranked data when the averaged responses of the 57 respondents is taken as a whole (Table 1). This is, of course, because the respondents are predominantly technology suppliers and water company employees.
Process robustness and Cost are both rated at around 100%, and ranked at 76% and 100% respectively. Against this, overall the Environmental impact and Water recovery/waste minimization are both scored at 37% or less according to both the rating and ranking measures. For the remaining two aspects of Process flexibility and Energy efficiency there was no consistency in the two sets of data, probably reflecting the ambiguous nature of these terms.
There are some important caveats to be made concerning cost and plant size. Total cost includes capital and operating expenditure, and the largest contribution to OPEX is usually energy. But the absolute energy cost, and the associated carbon footprint, becomes secondary to process reliability for small plant − as pointed out by two of the respondents. The cost of unscheduled maintenance in terms of $/m3 treated water, on the other hand, becomes hugely significant for small plants. In such cases, reliability becomes crucial.
| Position | Aspect, rating | Score | Aspect, ranking | Score |
|---|---|---|---|---|
| 1 | Process robustness | 100% | Life cycle cost/NPV | 100% |
| 2 | Life cycle cost/NPV | 98% | Process robustness | 76% |
| 3 | Process flexibility | 87% | Energy efficiency | 54% |
| 4 | Environ. impact | 37% | Process flexibility | 30% |
| 5 | Water recov./waste min. | 36% | Environ. impact | 23% |
| 6 | Energy efficiency | 0% | Water recov./waste min. | 0% |
In the UK municipal water sector, the total cost (or NPV, which amounts to the same thing) is the main contributing factor to decision making − as evidenced by the survey responses and by some of the comments. But, of course, the end users always want it all: low-cost and fit-and-forget solutions. This normally means reliable performance under variable conditions of flow and load, again highlighted by some of the respondents. Finally, location and available space can also be key factors determining process selection.
So where does this leave MBR technology? As a membrane technology, the product water quality is reliably high provided the membrane is unbreached. MBRs are also very compact and, for large installations at least, the NPV works out pretty much the same as for a conventional process delivering a comparable treated water quality (i.e. conventional activated sludge with some sort of downstream polishing).
Operationally, MBRs are certainly more complex and, in the experience of some, demand more unscheduled manual intervention than would a conventional process. But it is argued, particularly by the technology suppliers, that in many cases operational issues arise from an insufficiently conservative design, and specifically the pretreatment − both the screening and the degritting. It is worth stressing, not for the first time, that the finest, most fouling resistant and super-strong membrane material in the world behaves pretty much in the same way as a more modestly specified material when the channels between the membranes are ram-filled with sludge.
In summary, what this survey illustrates is what pretty much everyone would have suspected: cost, and in particular whole-life cost, is the key criterion in decision making. Perhaps worryingly, this trumps environmental considerations. On the other hand, environmental factors are taken care of by the legislation, and the technology is then duty-bound to meet the stringent environmental criteria. It's pretty much a given that the technology will meet the water quality discharge criteria, but the total cost incurred in doing this is the number one concern.
6. Annex 1 Survey questions
Question 1. How important are each of the following six factors in selecting a wastewater treatment technology? Assign a score out of 10 (10 being most influential) to each of the following six factors influencing wastewater treatment technology selection.
- Life cycle cost (also called Net Present Value − NPV)
- Energy efficiency (or lowest CO2 emissions) per volume water treated
- Process robustness (avoiding incidents demanding unscheduled manual intervention or unexpected additional cost)
- Environmental impact (with reference to environmentally negative discharges other than CO2)
- Process flexibility (greatest ability to handle high variation in water quality and quantity while still meeting treated water quality objective)
- Water recovery/lowest waste volume generated.
Question 2. Which type of effluent does your response refer to?
- Municipal
- Industrial
- Both
Question 3. Any comments regarding Question 1?
Question 4. Rank the six factors in the order they influence wastewater treatment technology selection. When deciding your ranking, take into account any comments you made in Question 3.
1 = the most influential factor, 6 = the least influential factor.
- Life cycle cost (also called Net Present Value − NPV)
- Energy efficiency (or lowest CO2 emissions) per volume water treated
- Process robustness (avoiding incidents demanding unscheduled manual intervention or unexpected additional cost)
- Environmental impact (with reference to environmentally negative discharges other than CO2)
- Process flexibility (greatest ability to handle high variation in water quality and quantity while still meeting treated water quality objective)
- Water recovery/lowest waste volume generated.
Question 5. Which of the following most closely describes your role?
- OEM/Technology supplier
- Water/wastewater municipality/company employee
- Consultant
- Contractor
- Academic
- Other.


