Ragging in immersed hollow fibre membrane bioreactors

S. Gabarrón1, M. Gómez1,2, H. Monclus1, I. Rodríguez-Roda1,3 and J. Comas1
1 LEQUiA (Laboratory of Chemical and Environmental Engineering). Environmental Institute. University of Girona
2 Department of Water Technology and Environmental Engineering, Institute of Chemical Technology, Prague
3 ICRA (Catalan Institute for Water Research). Scientific and Technological Park of the University of Girona
1. Introduction
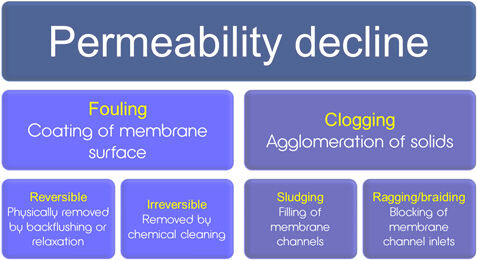
While most scientific articles about MBR systems suggest membrane surface fouling as being the main operational limitation for the technology, it is widely recognised by practitioners that clogging phenomena − possibly related to inefficient pre-treatment − are at least as important. It is also recognised that clogging takes different forms. ‘Sludging’ refers to the filling of membrane channels with sludge solids and depends on process design (membrane module and aerator, pre-treatment). ‘Ragging’ (or ‘braiding’) is the blocking of membrane channels with particles agglomerated as long rag-like particles (Mason et al, 2010; Stefanski et al, 2011).
Ragging is mainly associated with municipal wastewater treatment plants, since the rags are primarily made up of cellulosic fibres and hairs − possibly just cotton wool −based products (Stefanski et al, 2011). Whilst rags look like a continuous fibre bundle, they are actually an agglomeration of individual fibres that may be no more than a few millimetres long. The rags formed can be more than 1 m long, wrapping themselves around structures in the membrane tank (the membrane modules and the aerators) as well as becoming lodged in the membrane channels to form part of the sludging problem.
So, how important is ragging? This article is taken from a journal paper published in early 2013 in Water Science and Technology. It concerns a single, established 3,225 m3/day-capacity MBR WWTP in the north-east of Spain. This plant comprises pre-treatment based on coarse screen (8 cm), grit chamber, buffering (1,110 m3), fine screening (1 mm), a carousel bioreactor and two MBR tanks (A and B), with classical secondary sedimentation employed during peak flows. The plant was studied over a period of several months to assess the impact of ragging on its operation.
2. Testing
Standard methods were used to determine mixed liquor total and volatile suspended solids (MLSS and MLVSS), and sludge volume index (SVI), with capillary suction time (CST) and time to filter used to infer filterability. Particle size distribution (PSD) was also determined, along with conventional foulant indicators such as the protein and carbohydrate fractions of soluble microbial product (SMP) and bound extracellular polymeric substances (EPS). The method of Stefanski et al, (2011) was used to measure and characterise the coarse suspended solids (CSS) and determine the coarse suspended solids reconstitution (CSSR) − or rag-forming − tendency. Since it was primarily rag formation that formed the basis of the study, both feed and sludge solids samples were characterised with respect to fibrous materials (protein, polyamide, cotton, acrylic and polyester).
| MBR characteristic | |
|---|---|
| Volume of each membrane tank | 30 m3 |
| Membrane | Zenon, 500c (GE), PTFE, hollow fiber |
| Fibre, pore diameter | 1.9 mm, 0.04 µm |
| Total membrane area (both tanks) | 5808 m2 |
| SADm | 0.37 Nm3·m-2·h-1 |
| Filtration cycle | 10 min filtration/40 s backpulse (supplemented with ~6.3 mg/L NaClO) |
| Average flux | 27 ± 1 LMH |
| Types of clean: | |
|---|---|
| Maintenance cleaning (MC) | Backwashing with a solution of 140 mg/L of NaClO and 200 mg/L of EDTA for 45 minutes |
| Recovery cleaning (RC) | Backwashing with a basic or acid solution and soaking the membranes in this solution for 6−12 hours |
| Basic recovery cleaning (bRC) | RC using a NaClO (hypochlorite sodium) solution of 1,500 mg/L |
| Acid recovery cleaning (aRC) | RC using a C6H8O7 (citric acid) solution of 1,500 mg/L |
| Declogging (manually) (DC) | Removing membranes from the tank and cleaning them manually by removing the solids adhered to the membrane |
The permeability recovery can be described by the difference between the permeability immediately after cleaning (LC) and the permeability at the end of the previous test recorded immediately before the clean (Lend), as compared to the decline in permeability over the course of the cycle (Lstart− Lend):
3. Results
The permeability profiles for each tank (Figure 1) indicate values below 60 LMH·bar-1, generally considered low for HF iMBR operation (Judd and Judd, 2011). 14−16 chemical cleans were applied during the period between Day 120 and 280 prior to manual intervention (‘declogging’, DC): 10−12 maintenance cleans and four recovery cleans were applied to each tank during this period. Maintenance cleans (MCs) employed sodium hypochlorite and EDTA. Three of the four recovery cleans were alkaline (or basic, bRC) and used sodium hypochlorite, while the other was an acid recovery clean (aRC) using citric acid.
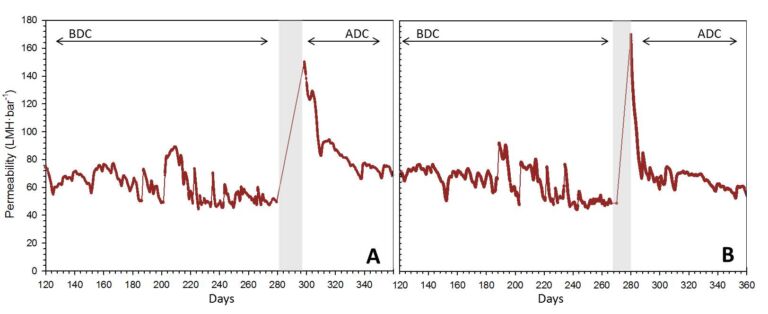
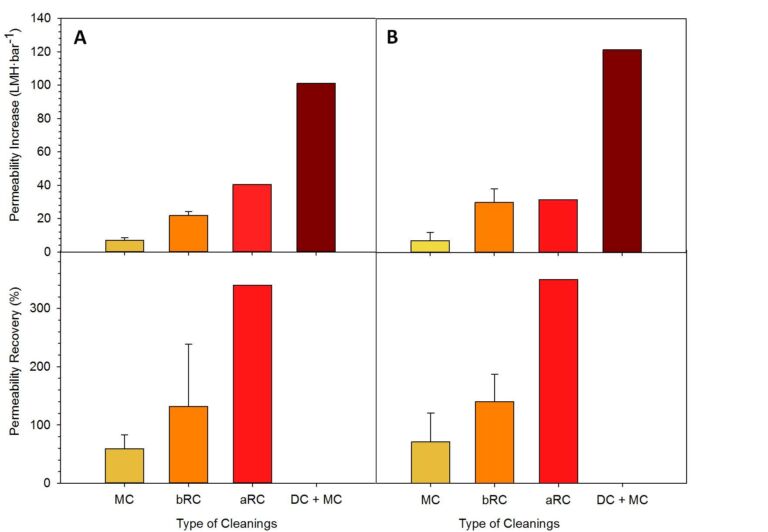
Mean permeability recoveries obtained from each type of cleaning prior to declogging (Figure 2) indicated recovery cleans to be at least twice as efficient as maintenance cleans, and acid recovery cleans to be more efficient than basic ones (perhaps because textile fibres are more soluble at low pH). However, recovered permeability values were insignificant compared to those obtained by declogging (DC), indicating chemical cleaning to be largely ineffective at removing gross accumulated solids associated with ‘sludging’. Whilst DC provided significant immediate permeability recovery, after ten days of operation, permeabilities dropped by 68−88%, similar to trends reported by Zsirai et al, (2012).
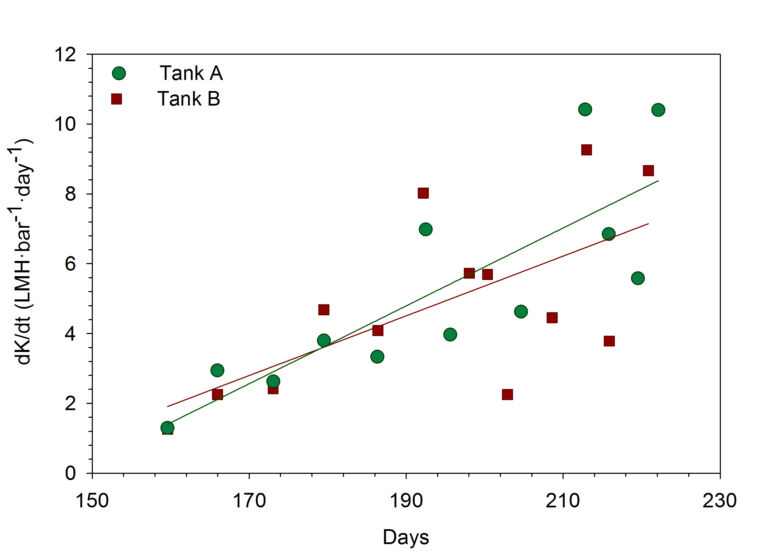
In the two-month period following the DC, 5−7 maintenance cleans were applied to each tank. Whilst MCs applied after the DC were slightly more efficient than those applied before it (BDC: K = 7 ± 3 LMH·bar-1; ADC: K =10 ± 5 LMH·bar-1), this improvement was insignificant compared to the overall loss of permeability from ‘reclogging’ − the accumulation of solids following the DC. Evaluated post-MC permeability decline trends (dK/dt in LMH·bar-1·day-1) revealed permeability decline to increase with time due to the accumulation of clogged solids (Figure 3).
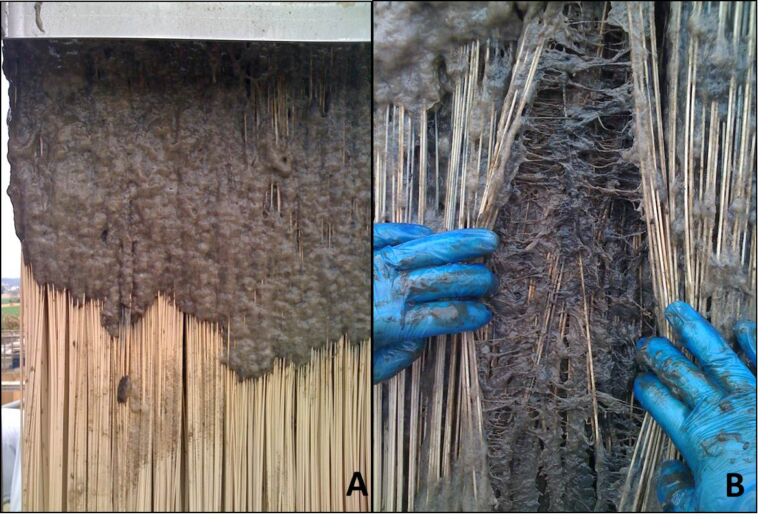
Visual inspection of the membrane modules conducted prior to manual cleaning revealed significant clogging at the top of the membrane cassettes (Figure 4) with a highly adherent ‘slimy’ material filling the membrane fibre channels and restricting their movement. On the other hand, the bulk sludge quality in terms of MLSS, MLVSS, SVI, CST, PSD and filterability, changed little throughout the study (Table 2) and could be considered ‘good’, with low CST and SVI (Khongnakorn and Wisniewski, 2010; Lousada−Ferreira et al, 2010).
| Parameter | Units | Average |
|---|---|---|
| MLSS | mg·l-1 | 6000 ± 1400 |
| MLSS | % | 78 ± 3 |
| SVI | ml·g-1 | 290 ± 90 |
| Filterability | ml | 30 ± 3 |
| CST | s | 62 ± 10 |
| EPS | mg·g SSV-1 | 13 ± 3 |
| Soluble proteins | mg·g SSV-1 | 2.7 ± 0.8 |
| Soluble polysaccharides | mg·g SSV-1 | 3.7 ± 0.6 |
| Bound proteins | mg·g SSV-1 | 3.5 ± 1.2 |
| Bound polysaccharides | mg·g SSV-1 | 3.4 ± 1.5 |
| PSD (% volume) | µm | 77 ± 10 |
The qualitative ‘ragging tendency’ test (Stefanski et al, 2011) was applied to the sludge adhered to the membranes through successive CSS fractionation (5 mm down to 63 µm). The test demonstrated reconstitution of the CSS solids as rags, up to 120 mm long, which were self-supporting when suspended. The mechanical integrity of the reconstituted rags was unaffected by the application of either detergent or hypochlorite, corroborating the reports of Stefanski et al.
The WWTP influent was analysed to characterise the textile fibres and cellulosic materials by applying screens of various ratings. The mean influent fibre concentration was 42 ± 21 mg/L, mostly below 1 mm in size and primarily cotton and cellulosic in origin. Optical microscopic analysis of the agglomerated rags revealed them to comprise primarily cotton fibres, in keeping with the observations of Stefanski et al, and as in the case of the feedwater.
4. Conclusions
This research clearly shows that, despite apparently good bulk sludge quality according to standard measurements such as SVI and CST, extremely onerous impacts on MBR operation can arise from very small filaments present at low concentrations. The agglomeration of these fibres into rags (or braids), recognised by practitioners for more than a decade but only recently reported in the scientific literature, is not significantly alleviated by fine screening.
The rags formed negatively affect performance, and the rag-forming tendency of the fibrous solids can be assessed by a bespoke test. This research shows the presence of textile fibres, at a concentration of 40 ± 20 mg/L and primarily composed of cotton of < 1mm length, can agglomerate as rags within the membrane. The empirical test revealed the clogging solids to form mechanically stable rags of 70−120 mm when suspended in air.
Clogging is characterised by the ineffectiveness of the chemical clean. Declogging produces an immediate permeability recovery, but a rapid deterioration arises: the permeability returned to 68−88% of the pre-declogged state within 20 days. The impact of clogging on absolute fouling has only recently been reported, and clearly demands further study. In this instance, it was found that reducing the flux from 27 to 23 LMH allowed sustainable operation, although ragging was still present and the permeability remained low at around 62 LMH/bar.


