Membrane bioreactor (MBR) performance for reducing energy demand

Seiko Kitagawa, Yasuo Oda and Manabu Sasakawa |Takanori Itonaga | Takaaki Adachi | C.B. Chidambara Raj and Kiran Arun Kekre
Seiko Kitagawa, Yasuo Oda and Manabu Sasakawa, Aqua Development Center, Aqua Division, Mitsubishi Rayon, 4-1-2, Ushikawa-dohri, Toyohashi, Aichi 440-8601, Japan
Takanori Itonaga, MRC Rensui Asia, 82 Toh Guan Road East, #02-13 WaterHub, Singapore 608575
Takaaki Adachi, Overseas Business Department, Nippon Rensui, 43-11, Minami-Otsuka 3-chome, Toshima-ku, Tokyo 170-0005, Japan, and
C.B. Chidambara Raj and Kiran Arun Kekre, Public Utility Board, 80/82 Toh Guan Road East, WaterHub, Singapore 608575
1. Introduction
This feature summarises recent research into a new membrane bioreactor technology applied for water reuse (NEWater, Singapore) with reference to energy demand. Reducing aeration demand for membrane air scouring combined with a high flux has been shown to significantly reduce energy demand. A demonstration study has been carried out to evaluate MBR performance with reference to the aeration demand for membrane scouring and membrane permeability. A lower energy demand was attained through a 40% decrease in membrane module size providing a higher packing density. The new module was demonstrated with a 300 m3/day capacity MBR plant. Results indicated the higher packing density to reduce the energy demand by 40% compared with the previous membrane module design.
A combination of micro filtration (MF)/ ultra filtration (UF) and reverse osmosis (RO) process for water treatment has received much attention recently [1]. In Singapore, a dual membrane system, such as MF/UF followed by RO, has been applied to produce high quality water, called 'NEWater', produced from municipal wastewater [2]−[4].
The MF/UF-based submerged membrane bioreactor has been applied to municipal wastewater treatment since the late 1980s [5]. The MBR offers advantages such as high quality of treated water and smaller footprint compared with the conventional activated sludge process [6], but incurs a higher operating cost. The major operating costs of MBR can be classified as membrane replacement, energy, chemical and labour. The energy cost of MBRs has a significant impact on the MBR life cycle cost [6], and many researchers have explored ways of reducing MBR energy demand as a way of reducing MBR operating cost [7]−[9]. Reducing aeration demand for membrane air scouring and maintaining a high membrane flux have a significant impact on the energy demand of MBR [10], [11].
The specific aeration demand (SADp) is a key indicator of MBR energy demand with respect to membrane air scouring [6]. SADp is the ratio of membrane aeration demand to flux. Developing MBR technology characteristics such as a compact membrane module, low-fouling membrane and efficient membrane air scour can lead to lower SADp values and thus reduced energy demand. In this study, experiments using a newly developed membrane module were carried out to evaluate MBR performance, specifically membrane permeability and SADp, in reducing MBR energy demand.
2. Material and methods
2.1 MBR configuration
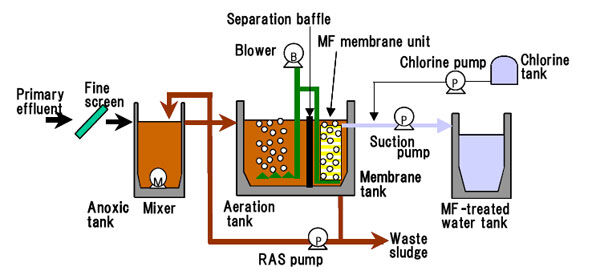
Demonstration tests of the MBR technology were conducted in Singapore. To optimise operating conditions, a large pilot MBR was installed and operated at the existing Ulu Pandan Water Reclamation Plant in Singapore. This treatment plant receives municipal wastewater from the central part of Singapore. The MBR consisted of the anoxic tank, aeration tank and membrane tank (Figure 1) for treating the municipal wastewater. This MBR was mainly designed to remove organic substances and nitrogen. The effluent from the existing primary clarifier was used as the feed water, and its treated water capacity was 300 m3/day. The effluent from the primary clarifier was fed to the anoxic tank of MBR via a self-cleaning 1 mm diameter pore size screen for removing fibre, hair and large suspended solids to protect the membrane. Air was supplied by using fine bubble diffusers which were installed at the bottom of the aeration tank. The air flow rate in the aeration tank was manually controlled with DO concentration at 1−2 mg/L. Activated sludge in the existing aeration tank at Ulu Pandan WRP was used for seeding the MBR.
2.2 Membrane configuration
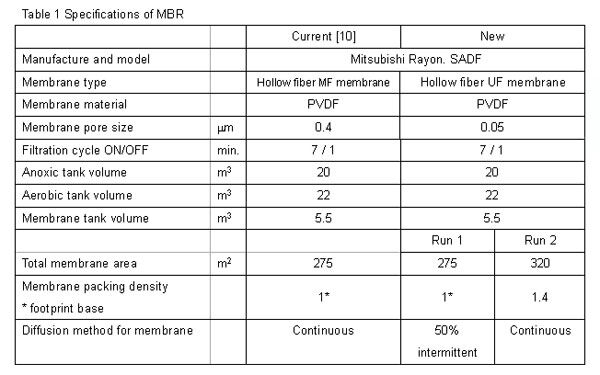
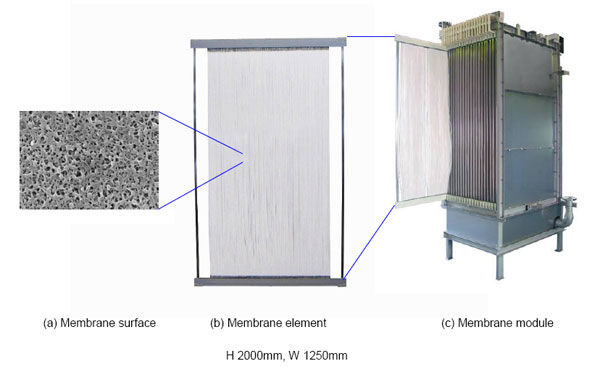
The newly developed submerged hollow fibre membrane module in the membrane tank was fed with air for membrane physical cleaning (ie scouring). The polyvinylidene fluoride (PVDF) hollow fibre membrane module had an effective membrane area of 320 m2; the membrane can be classified to UF membrane by its own pore size. This PVDF membrane has characteristics of high chlorine tolerance, physical strength and permeability. The module has been designed to reduce energy and footprint, having a 40% higher membrane area than the current product. Additional specifications of the MBR pilot plant and the membrane are shown in Table 1 and Figure 2.
Table 1. MBR Specifications I
2.3 Operating conditions
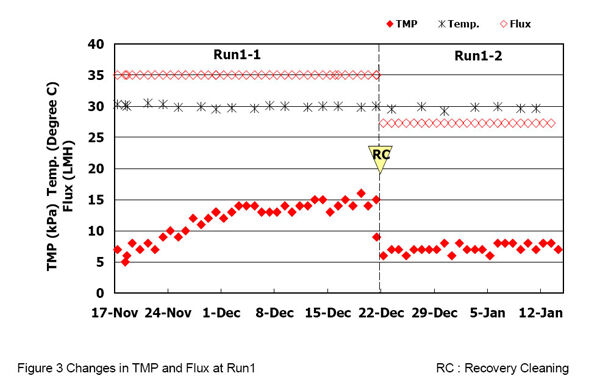
Two experiments were conducted to optimise the operating conditions of MBR, evaluating the quality of treated water and membrane permeability. Operating conditions are summarised in Table 2. Air was delivered below the membrane module, and operation of the filtration pump was cyclic. For reducing the required air flow rate for physical membrane cleaning, air was intermittently supplied in Run 1, compared to continuously in Run 2. The filtration pump was operated with 7 minutes of filtration and 1 minute relaxation. Recovery cleaning (RC) using 3,000 mg-Cl2/L hypochlorite solution for 2 hours was conducted prior to changing operating conditions.
| Run 1−1 | Run 1−2 | Run 2−1 | Run 2−2 | ||
|---|---|---|---|---|---|
| Operating period | days | 38 | 25 | 31 | 35 |
| Net flux | LMH | 35 | 25 | 25 | 30 |
| HRT | hr. | 5 | 6.5 | 6 | 6 |
| SRT | days | 8.0 | 9.5 | 6.6 | 7.0 |
| Ratio of return activated sludge, RAS | 2 | 2 | 3 | 3 | |
| SADp | 5.7 | 8.1 | 4.2 | 3.6 |
2.4 Analytical methods
SS, TOC, COD, BOD, T-N, T-P and Coliform were analysed in the MBR permeate by following Standard Methods (APHA 2001). Transmembrane pressure (TMP) was calculated from the difference of filtration pressure and static pressure. TMP was periodically monitored during the operating period.
3. Results − performance of MBR
3.1 MBR permeate water quality
MBR operation was conducted for over five months to evaluate permeate water quality. Feed and treated water quality is summarised in Table 3. Water quality was analysed once a week with respect to the biological treatment parameters BOD, COD, TOC, T-N and T-P. BOD, one of the indicators of biodegradable organic substances, was below 2.0 mg/L for the entire period despite short HRT (Tables 2−3). Nutrients such as Nitrogen are removed by a combination of the anoxic and aeration process followed by return of the aerobic activated sludge to the anoxic zone according to the amount of organic carbon source. As the result of effective nitrification in the aeration tank and denitrification in the anoxic tank, approximately 80% of nitrogen was removed.
Table 3. Summary of feed and treated water quality
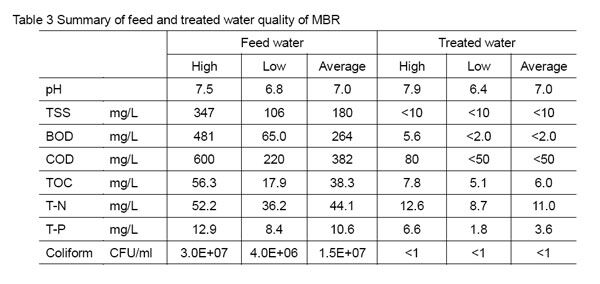
For evaluating solid/liquid separation performance of MBR, SS and Coliform were employed in this study. During the entire period of the test, SS and Coliform of treated water were less than their detection limit. Based on the water quality results, higher quality of treated water could be obtained for feeding the RO process.
3.2 MBR membrane permeability
Demonstration tests in Run 1 to Run 2 were carried out to evaluate the membrane permeability. Flux and TMP of Run 1 are shown in Figure 3, with intermittent aeration employed in Run 1−1 where the flux was set at 35 LMH. At 35-LMH flux operation in Run 1−1, TMP slowly increased from the initial value shown in Figure 3. After 2-week operation, TMP was relatively stable value. Based on Run 1−1, estimated CIP frequency was every two months. Following Run 1−1, flux was changed to 25 LMH for confirming stable TMP operation. The TMP remained constant for 25 days without any chemical cleaning during Run 1−2. Based on Run 1, acceptable flux for MBR design was 25 LMH when using intermittent aeration mode for long term operation.
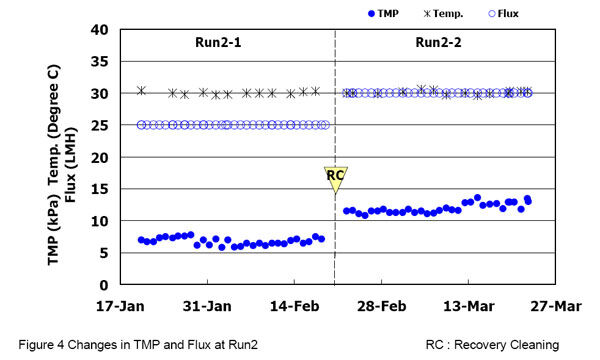
The flux and TMP of Run 2 are shown in Figure 4. After Run 2, the membrane module was replaced using ‘the’ newly developed membrane which has higher packing density. During Run 2, continuous aeration mode was employed for membrane physical cleaning. In Run 2−1, the flux was set at 25 LMH. As with the test result of Run 2−1, the TMP at this flux remained constant for 31 days. After confirming stable operation in Run 2−1, the flux was increased to 30 LMH during Run 2−2. During Run 2−2, the TMP remained constant for 35 days. Based on Run 2, acceptable flux for MBR design was more than 30 LMH using newly developed membrane for long term operation.
| 2004 | 2011 (Run 1−2) | 2012 (Run 2−2) | ||
|---|---|---|---|---|
| Flux | LMH | 33 | 25 | 30 |
| MLSS of membrane tank | mg/L | 10,000 | 10,000 | 7,500 |
| SADp | 11.3 | 8.1 | 3.6 |
3.3 MBR energy demand
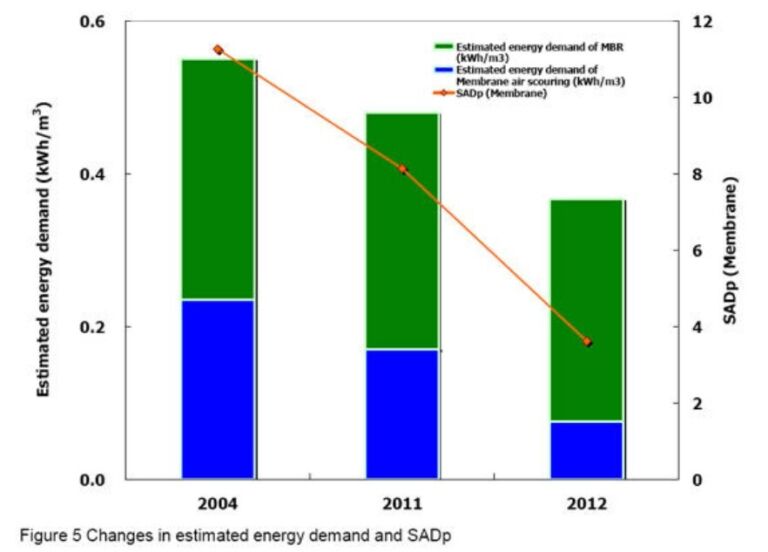
The purpose of this study was to reduce the MBR energy demand based on the design parameters shown in Table 4. SADp, one of the indicators of aeration demand for membrane physical cleaning, was calculated from the volume of air for membrane physical cleaning divided by the volume of treated water based on the demonstration test. As the result of replacing the existing membrane module with the newly designed one, SADp was reduced, as observed in Run 2−2 (Table 4). An approximate 70% reduction in air for membrane scouring was achieved using newly developed MBR membrane in comparison with Run 1−2 result.
The estimated energy demand of MBR was calculated using parameters shown in Table 4. The estimated energy demand of MBR was calculated from the total electric power value estimated from water quality shown in Table 5 and based on a flow of 23,000 m3/d. From an estimation based on 2004 data, the air for membrane scouring demanded 43% of the total energy (Figure 5). For the 2012 estimation, the air scour makes up only 24% of the MBR total energy demand. After developing the new membrane, the estimated energy demand of the MBR was 0.37 kWh/m3 based on the Run 2−2 parameters. As a result, a 40% reduction in energy demand can be achieved using the new membrane module compared with the existing one.
| Feedwater | Treated water | ||
|---|---|---|---|
| BOD | mg/L | 160 | 3 |
| SS | mg/L | 77 | 1 |
| T-N | mg/L | 40 | 20 |
| TKM | mg/L | 33 | 2 |
| T-P | mg/L | 9.2 | 0.5 |
| Alkalinity | mg/L | 173 | − |
4. Conclusions
A demonstration-scale study has been carried out to examine the performance of an MBR at the Ulu Pandan WRP in Singapore. The experimental results are summarised as follows:
- Stable MBR operation with high treated water quality and constant TMP was observed using a new module with a 40% packing density.
- The sustainable flux value of the newly developed membrane was 30 LMH without chemical cleaning.
- A 70% reduction in scouring air results from using the new module design compared with that from a decade ago.
- The minimum estimated energy demand of the MBR is 0.37 kWh/m3, based on the demonstration plant operating parameters.
To implement MBR technology for the NEWater process, a reduction in MBR life cycle costs is necessary. To reduce the MBR LCC for municipal and industrial applications, further developments are needed in membrane characteristics, membrane air scouring technology, and optimising operating conditions.


