Arla milk powder factory: membrane bioreactor plant for treating dairy wastewater
Bhupendra Poudel
The Arla factory in Vimmerby, Sweden selected the distinctive Grundfos BioBooster MBR technology when it expanded operations in 2012. Bhupendra Poudel of Grundfos BioBooster, Denmark reports on progress
1. Arla milk powder factory − client requirements
In 2012, the Arla milk powder factory in Vimmerby, Sweden planned to expand operations. The increased production process generated larger wastewater volumes which the receiving municipal treatment plant was unable to process because it had already reached its capacity limit. An upgrade would take 3−4 years to complete. Therefore, the dairy decided to build their own treatment plant on site, which needed to be installed within a short period of time and meet strict discharge requirements.
The company selected the Grundfos BioBooster packaged MBR plant as the solution. Pre-fabricated and modular, the BioBooster plant was installed and commissioned within a period of 6−7 months, allowing the dairy to expand production without compromising their license to operate.
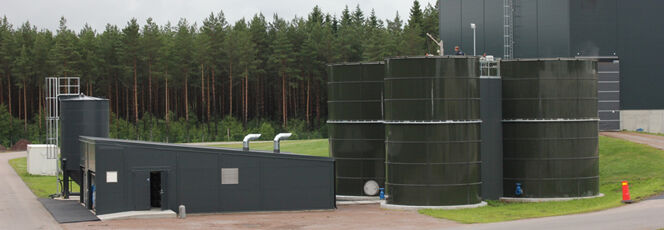
The Arla plant treats the wastewater generated from CIP plants used for cleaning various process areas within milk powder production facilities, removing organic matter, nitrogen and phosphorus in wastewater before it is directly discharged to wetlands.
2. About the BioBooster membrane technology
2.1 Design
The BioBooster represents one of the more unusual sidestream membrane bioreactor (sMBR) technologies and is one of only 2−3 proprietary MBR technologies in which the membrane module rotates. In the case of the BioBooster, the membrane is rotated rapidly enough (normally at 100 RPM or more) to generate mechanical shear, rather than the hydraulic shear of a conventional pumped sidestream system. The mechanical shear generated by rotating the membrane discs suppresses fouling without the use of air scouring, resulting in a relatively low energy demand (0.4−0.7 kWh/m3). While the use of a rotating or vibrating membrane for creating mechanical shear is not new, the BioBooster is currently the only example of such an approach applied to an MBR.
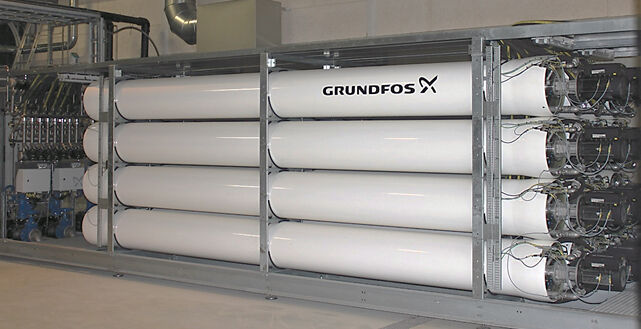
The module comprises a stack (or ‘wagon’) of 36 rotating, 0.2 µm-pore size, ceramic disc membranes of 500 mm in diameter. Up to five of these are placed in a 6,300 mm-long tubular vessel (Membrane Filtration Unit, MFU) to provide 34 m2 of membrane area, with the rotating membrane discs powered by a motor in one end of the MFUs (Fig. 3). The MFUs are then assembled to form a skid of 16 MFUs (Fig. 2). Permeate from each MFU is collected in a combined outlet pipe before being discharged to a collection tank for water quality monitoring.

2.2 Membrane operation
Permeate flow from the membrane is automated according to the flow demand from consumer or influent flow scenarios. Membrane operating set points such as TMP, filtration and backwash time, and feed pressure are automatically changed to predefined set points according to the permeate flow. This allows the membrane to auto-adapt to the optimal operating set point without manual intervention. Most of the time, membranes are operated with a typical filtration duration of 10−15 minutes with periodic over-pressured backwash for 10 seconds. Under normal operating conditions, the transmembrane pressure (TMP) is typically between 0.2 to 0.5 bar. However, this value might increase under severe membrane fouling or reduced sludge filterability. Disc rotation is between 100 and 140 RPM, depending on the fouling state of the membrane.
3. Treatment process and plant operation at Arla
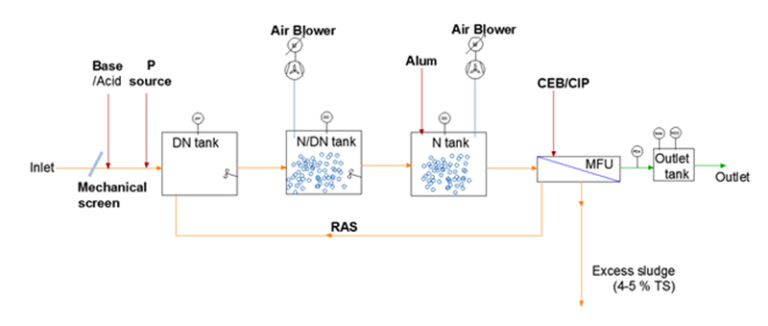
Figure 4 shows the simple process flow diagram for the Arla MBR plant. A rotating mechanical screen (<1 mm) is used as a part of the pretreatment process, removing larger influent particles prior to biological treatment. The pH and, if required, the C:P ratio are adjusted automatically in the screened wastewater, based on the output from online sensors. COD/BOD and N are removed biologically, and P removed by chemical precipitation by alum dosing when demanded by very high levels of P in the influent. A pre-denitrification process followed by aerobic nitrification is used for biological N removal. Sludge from the N tank is filtered by the sidestream membrane skid, producing clean permeate for quality monitoring before it is discharged to wetland. Rejected sludge from the membrane filtration stage is then diverted back to the DN tank as a part of return activated sludge (RAS). The treatment plant treats 400−450 m3 wastewater daily, representing part of the total wastewater produced at the dairy.
The influent wastewater experiences large variations in organic and inorganic loading, pH, temperature, and other water quality determinants relating to the CIP cycles at the dairy. Consequently, online instrumentation and advance process control has been integrated into the plant to achieve stable operation under fluctuating influent conditions. Treated water quality is monitored in real time by an online sensor and is used for feedback response to the process control at the reactor tanks. For example, online effluent P monitoring is used for P source or alum dosing in the plant, whereas the ammonium level defines the N/DN mode durations in the N/DN tank.
Over the past two years the following operating parameters (Table 1) have been observed in the Arla MBR plant, which more or less align with typical dairy wastewater treatment systems. Occasionally, very high organic loads, increases of 20−30%, are experienced in the plant, which then result in increased sludge production. The MBR plant has been able to meet the discharge criteria for the entire period, even under fluctuating influent load conditions (Fig. 5). Table 2 shows the average inlet and outlet water qualities over the operating period at Arla.
| Sludge yield | 0.24−0.26 | kg SS/kg COD | |
| MLSS | 9−14 | kg/m3 | |
| SRT | 15−20 | days | |
| F/M (loading) | 0.18−0.3 | kg COD/kg SS, day |
| Parameters | Inlet | Outlet | Outlet discharge limit |
|---|---|---|---|
| Total COD, mg/L | 3320 | 30 | <70 |
| Total Nitrogen (TN), mg/L | 249 | 5 | <20 |
| Total Phosphorus (TP), mg/L | 22 | 0.21 | <0.5 |
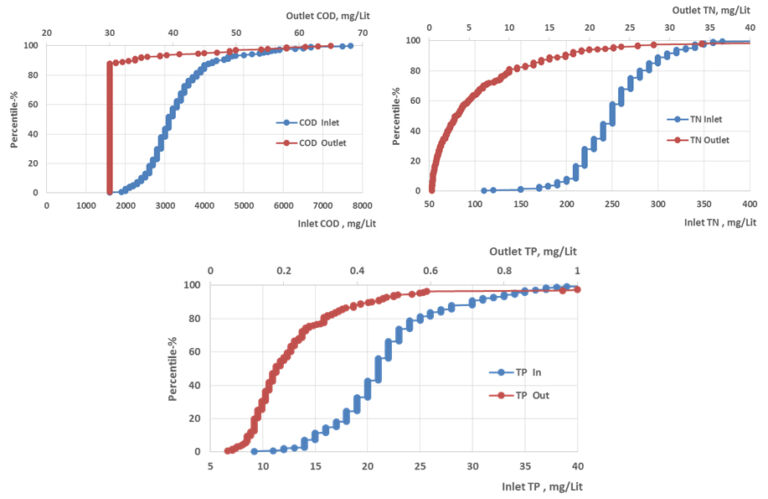
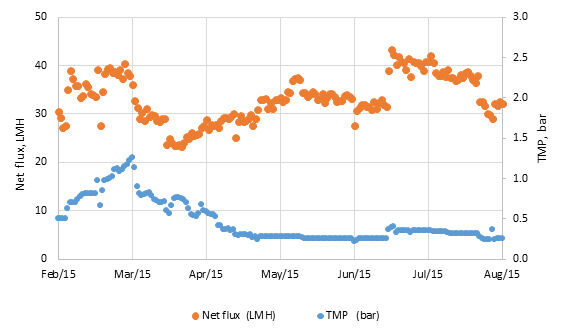
Figure 6 shows the flux and TMP in the MFUs over the last 7−8 months at Arla. The flux shown in LMH is the net flux, which is approximately 12−15% lower than the gross flux in the membrane. For the year 2015, an average flux of 35 LMH has been observed at an average TMP of 0.44 bar in the MFUs. This flux is relatively low, compared to other Grundfos installations such as hospital effluent and municipal wastewater installations, where a net flux of 45−50 LMH has been observed. In this installation, both membrane fouling and sludge quality (filterability) have contributed to the reduced flux. As illustrated in the graph, between February and March high fouling was observed on the membrane, demanding a high TMP to sustain the flux, whereas an improved sludge quality enabled the MFUs to operate at higher flux and lower TMP levels after April. A CIP was performed to reduce the TMP level in MFUs followed by reduced production demand in March. Depending on the cleaning cycles in the upstream dairy production processes, occasionally high fluctuating levels of total dissolved solids (TDS) are experienced in the influent. This has sometimes affected sludge character and resulted in lower sludge permeability in the treatment plant.
Depending on the TMP increment, automatic chemically-enhanced backwashing (CEB) or cleaning in place (CIP) is carried out on the membrane units without operator intervention. Chemical cleaning is conducted one MFU at a time, allowing the other MFUs to continue permeate production. During a CEB, chemical solutions are pumped from the permeate side of the membrane, whereas during a CIP they are fed from the retentate side after first removing the sludge. A 2% caustic solution of sodium hydroxide and hypochlorite followed by a 1−1.5% mixture of nitric and citric acid chemical solution is used for both the CEB and CIP processes. Typically, CEB cleaning is applied 3−4 times a month with an average chemical (acid + caustic) use of 0.01 L/m3 produced water. CIP cleaning is employed typically 1−2 times annually. Heating the CIP solution to 35−40 ºC has been shown to be very effective for membrane chemical cleaning, with a soaking duration of 1−2 hours.
Under reduced production demand, energy use at MFUs is conserved by shutting them down with periodic sludge flushing (every 30−60 min) to the reactor tank. The UF filters are capable of running at a high MLSS concentration, and are therefore used for excess sludge dewatering up to 4−5% total solids whenever MLSS levels are high in the reactor tanks. Membrane dewatering is by dead-end filtration, thereby up-concentrating the MLSS within the MFUs. This enables reduction of the excess sludge volume by up to 3−4 times, without installing a sludge dewatering unit and also without compromising the permeate production capacity of the membranes.
4. Cost of running the MBR plant
The operating cost of the Arla MBR plant has been calculated based on electricity and chemicals demand, operator (labour) effort and sludge handling costs, as shown in Figure 7. The total running cost for the plant for the last two years has been calculated as 0.59 EUR/m3 treated water on average.
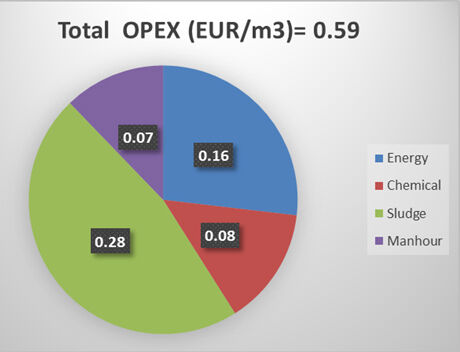
The two blowers used for aeration in the N and N/DN tanks account for almost 67% of the total electricity costs. Due to high COD and TKN in the influent wastewater, oxygen demand is relatively high for the biological process. However, aeration costs have been optimised in the plant by having a water height of 7.5 metres in the aeration tank, thereby increasing the oxygen transfer rate. This has enabled the plant to reduce the specific aeration energy use down to 0.65 kWh/kg COD removed. Energy used by the membrane system is 0.63 kWh/m3, accounting for 19% of the total energy costs. Other equipment, such as pumps, mixer, pre-treatment system, ventilation etc, consume the remainder of the energy. The average total electricity consumption in the plant has been determined as 3.32 kWh/m3, equating to a cost of 0.16 EUR/m3.
Different chemicals are used in the treatment plant for various purposes. Acid or caustic is used for maintaining pH in the reactor. More acid (80% sulfuric) is employed for pH correction than base due to the predominantly higher pH of the influent (>10). The average acid consumption for the plant is 0.15 L/m3, contributing the largest chemical cost in the plant operation. Due to the low C:P ratio, alum dosing is carried out only when the influent wastewater has a high P content. The chemical cleaning cost for the membrane is only 0.02 EUR/m3 treated water, which is marginal compared to the total operating cost of the plant.
The plant has comparatively low staffing costs because it is highly automated. Staffing hours are mainly spent refilling chemicals, and for routine checks, logging plant status, and calibration of online sensors. This amounts to an average of 5−6 hours per week, which is much lower than for other effluent treatment plants. Excess sludge handling is the major operational cost of the plant, contributing 48% of the OPEX. The treatment plant does not have sludge treatment, other than sludge dewatering from the membrane.
5. Summary
Installing and commissioning an MBR solution at Arla−Vimmerby has enabled Arla to expand their dairy production capacity within a relatively short period of time, and without having to wait for their existing municipal WWTP to be upgraded. Furthermore, the BioBooster MBR plant has demonstrated stable operation throughout, meeting all discharge requirements even under varying influent conditions.


