Labour, waste management and other wastewater treatment costs

1. Labour
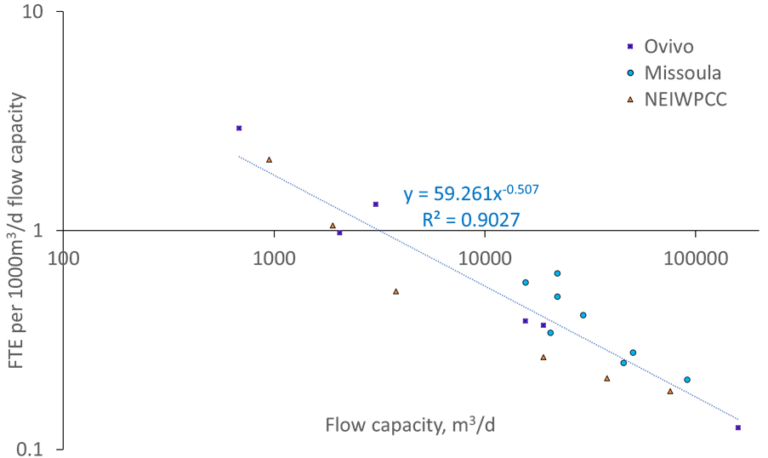
While often overlooked in academic papers, the labour costs associated with operating a membrane-based plant can be as significant as the energy cost, according to recent analyses (Qiblawey and Judd, 2019; Judd and Carra, 2021). The labour effort normalised against the size of the plant tends to increase for smaller plants.
Based on the combined data from three different sources, Qiblawey and Judd (2019) determined the labour effort (as full time equivalent or FTE) per installation unit flow capacity to follow a power relationship:
where MLD refers to megalitres per day and the flow capacity Q takes units of m3/h.
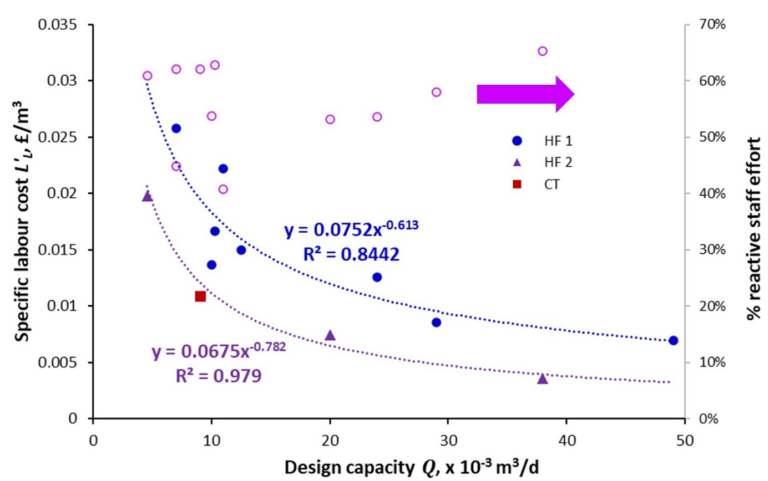
An analysis of data provided by UK water companies relating to the operation of potable water membrane filtration plants by Judd and Carra (2021) indicated the specific labour cost to also follow a power relationship:
where k = 0.0675−0.0752 and n = 0.613−0.782 depending on the membrane technology installed.
Both of the above analyses indicate the labour effort and associated cost, normalised against either plant flow capacity or permeate product volume, to follow an inverse power relationship with installation size. Compared with other operational expenditure components, such as energy and membrane replacement, there is a significant increase in specific cost for smaller plants.
2. Other wastewater treatment costs
Apart from the principal costs of energy expenditure and labour effort, the other key contributors to operating expenditure are membrane replacement, chemicals consumption and waste management.
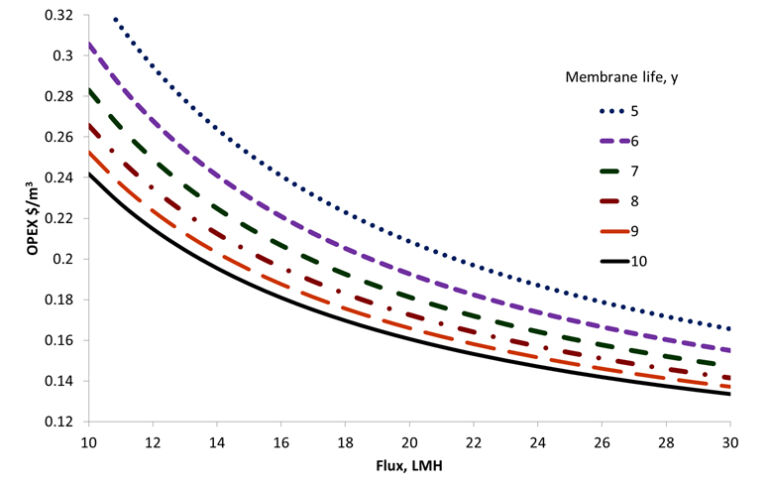
Membrane replacement costs decrease with increasing flux, increasing membrane life and decreasing specific membrane cost per unit membrane area. For an MBR, the membrane life for a polymeric membrane challenged with municipal effluent is generally 8−10 years. The life is usually shorter for industrial effluent applications. For ceramic membranes the membrane life is considered to be 50−100% longer than for polymeric membranes, and the net operating flux higher.
Chemicals costs relate primarily to the cleaning reagents used, i.e. hypochlorite and citric acid. The specific chemicals cost thus depends on the concentrations used, the frequency of application and the bulk reagent cost.
Waste management costs are very site specific. The primary waste produced from an MBR is the waste activated sludge (WAS). The cost of managing and disposing of this waste stream thus depends on whether there are on-site facilities for thickening/dewatering or digesting the sludge, or whether it instead has to be tankered off site for processing. If the latter applies then the cost depends on the cost of tankering and end processing.


