MBR OPEX − the theory of running costs


Simon Judd
With the coming of age of MBR technology, the next thing on the agenda seems to be the subject of MBR costs. Simon Judd explains the fundamentals of working it out. In theory. Simon can be contacted at simon@juddwater.com.
1. The operating expenditure (OPEX) of an MBR
One of the concerns of MBRs is their operational costs, which even the most optimistic (but nonetheless realistic) of cost analyses reveals to be marginally higher than those of conventional activated sludge (CAS). The reasons behind this are fairly obvious. Firstly, permeating water through a membrane demands energy. In the case of the immersed technologies (iMBRs) this means that the overall specific aeration demand (SAD) is higher, since air is needed both for maintaining the process biology in the aeration tank and scouring the immersed membrane. For a sidestream MBR (sMBR) energy is used for pumping the sludge through the membrane channels. Secondly, membranes have a limited life. Although the ceramic membranes presumably last a lot longer, it is normal to assume a life of 8−12 years for a polymeric membrane.
To calculate the actual costs requires key information concerning the plant design and operation. For the process biology these are the same as for CAS modelling:
- the feed and treated water quality, and specifically the COD, BOD and ammoniacal/amino nitrogen (or total Kjeldahl nitrogen, TKN)
- the mixed liquor suspended solids (MLSS) content in the aeration tank.
If CAD packages like Biowin or West are to be used for the biological process design then the above is probably sufficient, since estimates of the key fundamental biokinetic and biochemical parameters are provided in the package. However, if starting from scratch, and if only the actual running cost is required, then the estimated sludge yield in kgMLSS generated per kgCOD feed is needed. To complete the calculation demands an estimate of the amount of COD and TKN required to sustain the biomass in kgCOD and TKN per kg MLSS. Finally, the efficiency of oxygen transfer from the air bubble into the biomass, the standard oxygen transfer efficiency (SOTE) per unit depth has to be estimated.
On the membrane side the key parameters influencing OPEX are:
- the cost and life of the membrane
- the permeate flux
- the specific aeration demand for membrane scouring (SADm) for an immersed membrane, or
- the pressure and crossflow rate of a sidestream (pumped) membrane in an sMBR
- the energy demand of membrane permeation (for an immersed membrane: for sMBRs it is accounted for by (4) above.
Finally, for any MBR technology there are additional costs associated with:
- energy for pumping the sludge between tanks (aeration to membrane tank, membrane tank to anoxic zone for denitrification and also to an anaerobic tank for P removal)
- process control energy demand and maintenance
- chemicals for membrane cleaning
- labour
- other miscellaneous site services.
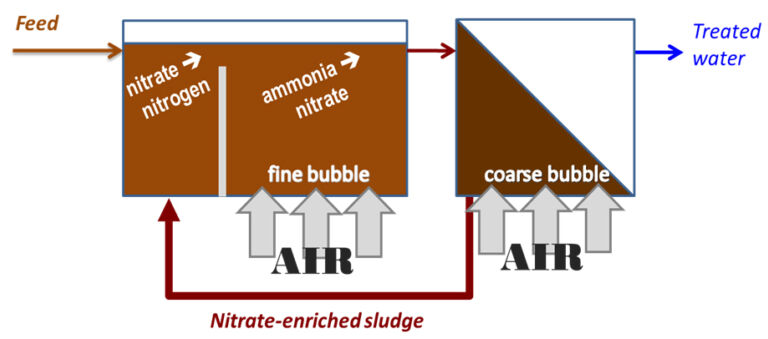
Apart from labour and site services, which are location and site-specific, a reasonable estimate of all other costs can be made. OPEX is ultimately determined in units of cost per m3 of treated water. The example below refers to a simple Modified Ludzack−Ettinger (MLE) process for nitrification-denitrification.
2. Process biology OPEX
The base parameter values provided for the wastewater for treatment by an activated sludge process technology are as follows:
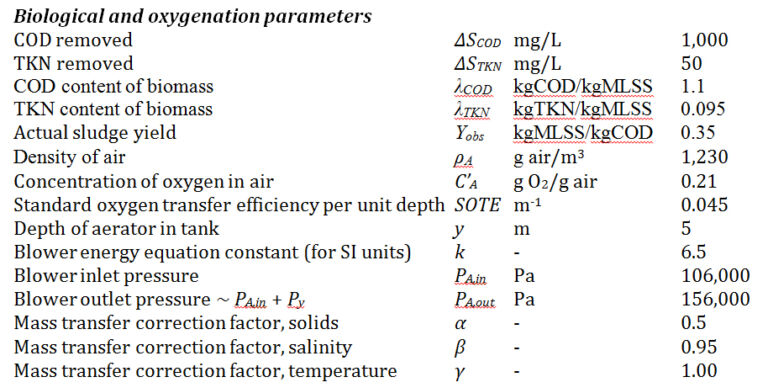
The operational expenditure (OPEX) can be determined from the equations for:
1. Oxygen demand from COD and TKN loading in g/m3 O2:
2. Aeration demand from calculated oxygen demand in Nm3 air/m3:
3. The specific aeration energy demand for air pumping in Ws/Nm3:
The specific energy demand for biological process aeration (EL,bio) in units of kWh/m3 treated water is then the product of these two parameters:
Inserting the relevant values into Equation 1:
From Equation 2:
From Equation 4:
So:
3. Membrane separation OPEX
3.1 iMBR
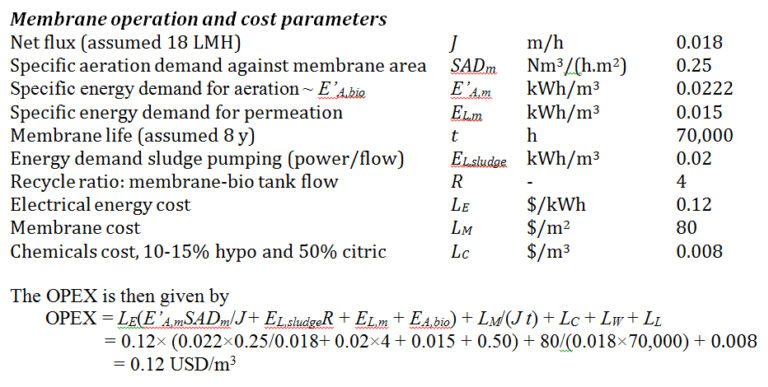
The base data provided for the cost determination are listed below. E’A,m is assumed to be the same as EA,bio, which is justifiable if the aerator is at the same depth. EA,bio in units of kWh/m3 is 80,000/(3,600 x 1,000) = 0.0222.
3.2 sMBR
In the case of a pumped sidestream technology fitted with horizontal modules there is no air scouring of the membrane, the shear being created by the crossflow. The energy demand is therefore determined from Bernoulli’s equation:
where appropriate values may be:
The conversion refers to the proportion of the retentate passing through the permeate channels which is converted into permeate. This in turn can be determined from the membrane module characteristics (specifically the membrane area and the available cross-sectional area) and the net flux. Appropriate values for a food and beverage application might be:
So, the total cross-sectional area of the tube is:
If only 85% of this cross section corresponds to the membrane channels then the available cross-sectional area is:
The retentate flow is the product of the crossflow velocity v and the above available cross-sectional area:
The permeate flow per module is the product of the flux and the module membrane area:
If the sludge passes through eight such tubes then the total conversion is:
So,
This figure (EL,m for the sidestream MBR) displaces the terms for energy demand relating to membrane air scour, permeate pumping and sludge transfer in the corresponding equation for the immersed technology:
4. Cost curves
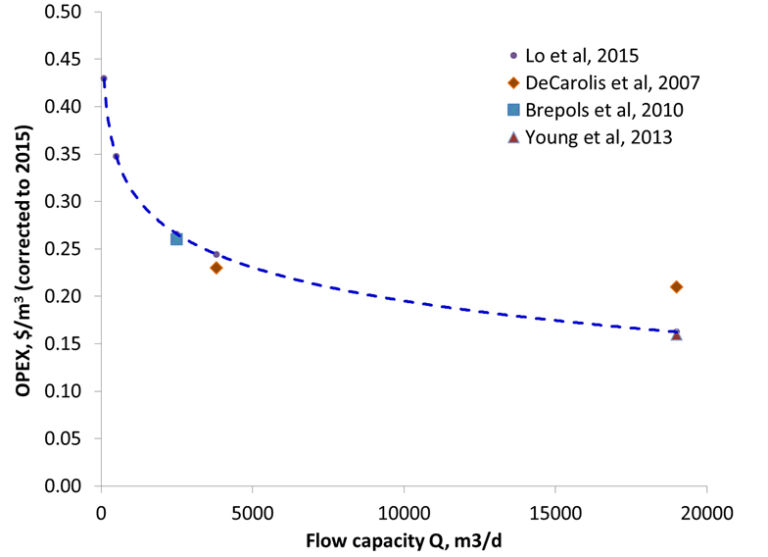
This simplistic approach implies that OPEX is independent of flow, which is not actually the case. However, a number of published cost analyses suggest that there is only a shallow decline of OPEX with flow. According to the study of Lo et al (2015), who considered three different flows ranging from 100 to 2500 m3/d, the OPEX cost curve (in 2015 USD) from entirely heuristic data is given by:
This curve seems to be in reasonable agreement with other published studies (DeCarolis et al, 2007; Brepols et al, 2010; Young et al, 2013), generally based on much larger MBR installations.
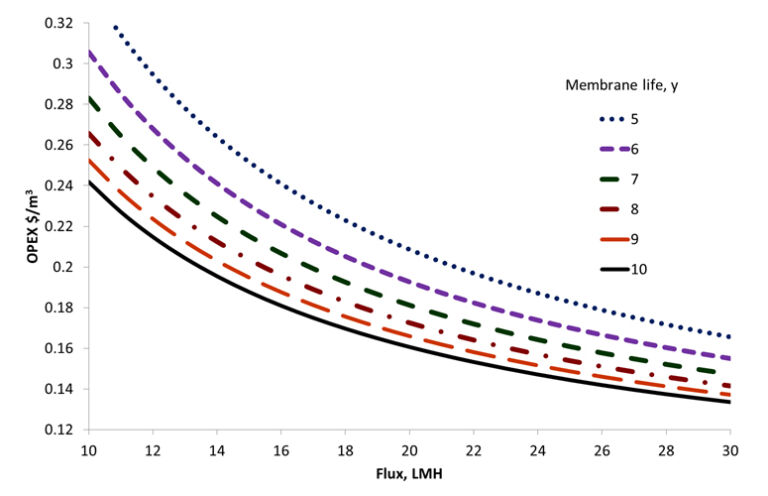
Since OPEX is most sensitive to design flux and membrane life it is of some interest to correlate the cost against these two parameters based on the assumptions given in Section 3.1. Accordingly, it can be seen that doubling the membrane life from five to ten years decreases the overall OPEX by 24%. However, this is based on a membrane replacement cost of $80 per m2 membrane area, which is perhaps overly conservative. If the membrane cost is reduced to $20 per m2 membrane area then this figure comes down to 9%.
Clearly, OPEX is only part of the cost calculation. For a complete analysis the capital cost (CAPEX) is needed, which then demands information on the price of equipment, installation services − largely comprising mechanical and electrical (M&E) and civil engineering, legal and contracting costs, land and other sundry items. These vary considerably between technologies, locations and overall approaches to costing per se (i.e. which items are included, which is a rather vexed issue). However, given that OPEX generally contributes more to the overall total cost (TOTEX) over the life of the plant, and can be estimated reasonably easily it’s perhaps worth at least doing this much before reaching for the cheque book.


