A decade of simultaneous nitrification and denitrification experience in MBR applications

Chintan Parikh, Hiren Trivedi and Dennis Livingston
The authors are MBR specialists at Ovivo Water, Austin, Texas, USA
1. Introduction
Biological nitrogen removal from wastewater typically happens through aerobic nitrification (from ammonia to nitrate) and anoxic denitrification (nitrate to nitrogen gas). This is usually carried out in two separate process tanks other than in a sequencing batch reactors (SBRs). However, it’s been recognised for some time that it is more energetically efficient to convert ammonia directly to nitrogen gas, since it requires less oxygen.
It is particularly advantageous to do this in an MBR where the sludge concentration is higher and the oxygen transfer efficiency subsequently lower, making each molecule of dissolved oxygen (DO) more expensive. If conversion is directly from ammonia to nitrogen gas, there is less oxygen required, reduced air pumping and therefore less energy demanded.
Biochemical conversion in this manner is referred to as simultaneous nitrification and denitrification (SND), and has been around for at least 20 years having been applied to aerobic biofilm systems, fluidised beds, SBRs and, yes, MBRs. Given that SND can reduce energy demand by up to >30% as well as reducing the area-print, the question that inevitably arises is: what’s not to like?
2. What’s not to like?
Like most things that seem too good to be true, SND is not without challenges. The low DO concentrations slow down the biochemistry, encourage the growth of filamentous bacteria (see Simon Judd's MBR blog) and demand rigorous process monitoring and control. Whereas the latter is classically based on monitoring of the DO concentration and the oxidation−reduction potential (ORP), these determinants can be insufficiently rigorous for SND.
Another control parameter that can be used to promote SND is the concentration of an energy transfer coenzyme called nicotinamide adenine dinucleotide or NAD. The relative concentration of NADH (the reduced form of NAD), can be measured by tracking biological fluorescence. It so happens that NADH absorbs light at 360 nm and fluoresces at 460 nm (a visible blue light). The strength of the 460 nm signal gives an indirect measurement of NADH concentration and consequently the metabolic state of the process. At higher concentrations of NADH, a process is anaerobic. At lower concentrations the process moves from anoxic to aerobic states in proportion to measurable trends.
NADH monitoring coupled with DO measurements has been used to gather effective, real-time information on biological activity and used successfully to maintain a balance between nitrification and denitrification and to ensure SND. Overall, the strategy to address all concerns related to SND has been to:
- alternate between high DO and low DO cycles
- couple DO measurement with NADH monitoring whenever possible.
Performance of several conventional and MBR facilities incorporated with SND were evaluated and the data collected are presented here. The conventional and MBR system flow configurations range from single, completely mixed tank to 4/5-stage Bardenpho® type processes.
3. Case studies − Islamorada, Nassau and Rio del Oro WWTPs
3.1 Islamorada WRF, FL (4-stage Enviroquip® MBR System)
Islamorada, FL (located in Plantation Key) was historically serviced by a traditional septic tank system. However, the coral island has little capacity to handle septic supernatant. Because of this, the septic system was contaminating surrounding waters which led to algal blooms and fecal coliform contamination in some areas, restricting recreational use of the water. A decision was made to upgrade to MBR technology to treat higher flows, in a small area print and attain reuse quality standards.
The WRF was designed to treat a maximum month flow of 0.37 MGD and peak flows up to 0.50 MGD. The plant was also designed to meet BOD/TSS/TN/TP limits of 5.0/5.0/3.0/1.0 respectively: the TN limit is an annual average and phosphorus removal is achieved through chemical addition. The treated effluent is delivered to either a reuse storage tank or a local aquifer. When the effluent is used for reuse, it passes through UV disinfection and then irrigates baseball fields and other green spaces in the community. This additional step is not necessary when the effluent is injected into the well.
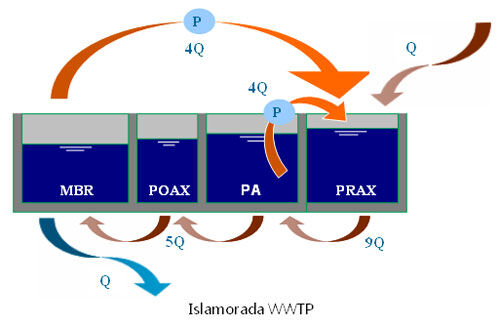
The plant has been in operation since July 2006 with no violations. Raw wastewater is pumped from the Equalization (EQ) tank through fine screens into the MBR process at the Pre-Anoxic (PRAX) zone where it is mixed with recycled activated sludge. From there, it flows into the Pre-Aeration (PA) zone where aeration (oxygen delivery) is controlled to achieve SND. A portion of the activated sludge then flows by gravity into the Post-Anoxic (POAX) zone for further denitrification with the remainder of the flow being pumped back into the PRAX zone. From the POAX zone, mixed liquor flows by gravity to the MBRs. Thickened mixed liquor from the MBRs is pumped back to the PRAX zone to complete a second internal recycle loop: this serves to stabilize mixed liquor concentrations and enhance denitrification. The process has worked well, meeting or exceeding permit requirements each year.
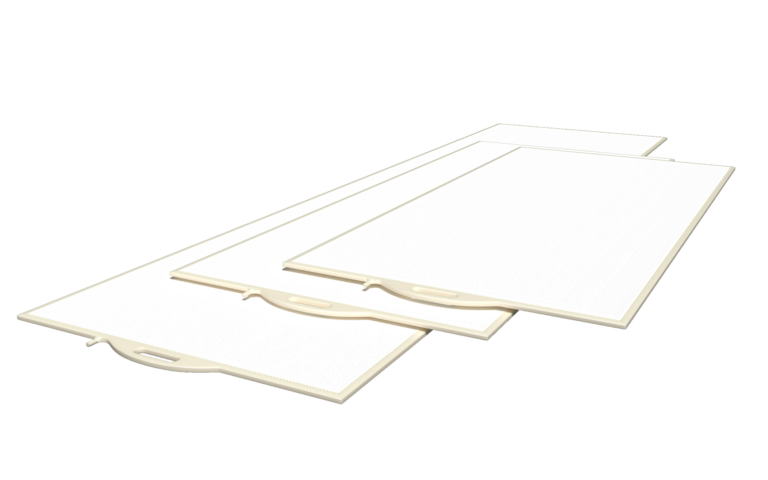
Depending on the type of membrane technology, the tank or basin used to house submerged membranes can contribute more or less of the biological process. For the Islamorada process, KUBOTA EK-400 submerged membrane units (SMU) were selected with a hydraulic residence time of roughly 2.5 hr. The inventory of biological solids in this volume coupled with the oxygen contained in the scouring air used to keep the membranes operational, leads to some level of nitrification.
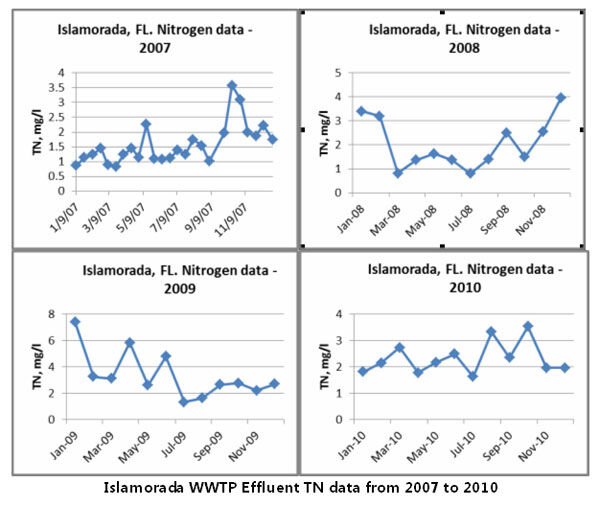
Some interesting features of this plant include the direct recycle from the MBR zone to the PRAX zone and the ability of the process to reliably meet the TN target at low loading and given the size of the MBR and amount of air scour. The variability from year to year in effluent TN is partially a function of different carbon dosing. Carbon dosing was reduced in 2008 with a corresponding increase in 2009 that improved treatment.
3.2 Nassau WRF, FL (4-stage Enviroquip® MBR System)
JEA (formerly the Jacksonville Electric Authority) owns the Nassau Regional WRF. Before the MBR upgrade at Nassau, it was a 0.30 MGD wastewater treatment facility servicing a number of small developments in the area. To accommodate anticipated population growth in the region the capacity of the existing facility needed to be expanded. It was determined that MBR technology provided the right mix of high quality treatment, ease of operation and small area-print required for this application.
Commissioned in January, 2006 the design−build project was delivered for $8.97M and designed to handle a maximum month flow (MMF) of 2.60 MGD (with peak daily flows up to 8.0 MGD). The plant has three effluent permits; one for onsite reuse (R001) and two for off-site reuse or wetland discharge (R002/R003) that require total nitrogen to be less than 3.0 mg/l. R002/R003 compliant effluent is used for irrigating a variety of green spaces throughout the community.
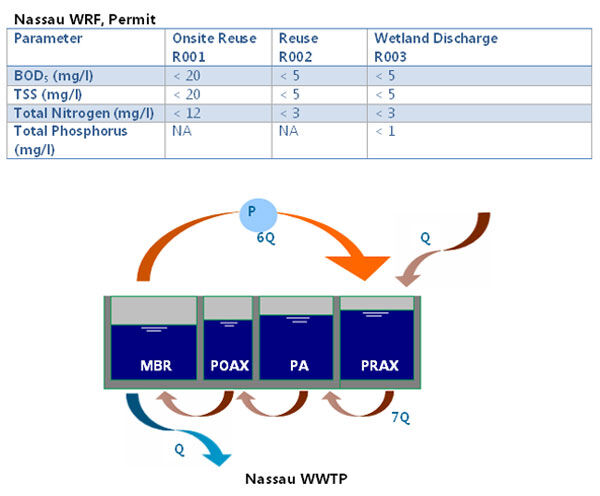
To achieve an effluent total nitrogen concentration of less than 3.0 mg/l, a four-stage biological process consisting of PRAX, PA, POAX and MBR zones was selected with a single recycle. Predicated on achieving SND in the PA zone, the flowsheet simplified the process and helped to control costs but does limit the overall turndown ability of the plant. Moreover, value engineering decisions made during construction that reduced the number of blowers and pumps by 50% compounded the turndown issue and made hitting nitrogen limits more challenging. In fact, during 2007/2008, while flows (pollutant loading) were considerably lower than the design flow (33%−50% of design flow) it was a challenge to operate the plant to consistently meet nutrient requirements.
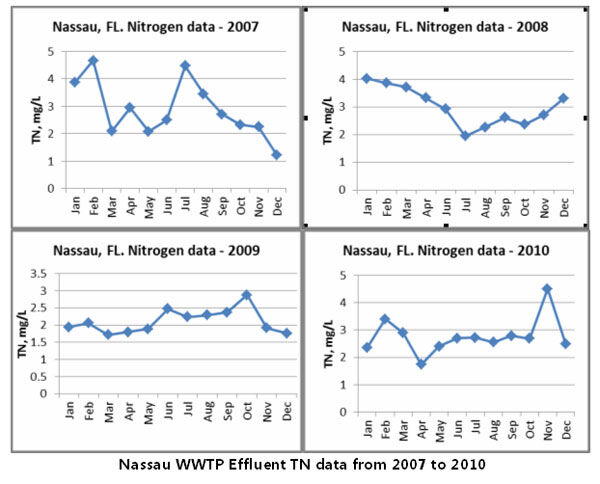
Limited process and aeration turndown made SND control difficult, if not impossible, using NADH monitoring as the residual DO in the single recycle was too high. The high DO, and corresponding control issues, was only part of the problem. At the Nassau WRF, influent comes from 48 independent lift stations and tank freeboard is roughly 7” leaving little margin for error. Numerous ideas were discussed including the addition of supplemental carbon, splitting the influent to put more rBOD into the POAX zone and modifying equipment. In the end, the plant operators implemented a unique strategy to increase POAX volume by cycling the MBR in service (filter mode) and cycling the blowers ON/OFF to facilitate SND (due to limited turndown the blowers weren’t able to meet the lower DO set points). The results were significant and the plant has consistently met total nitrogen targets without the addition of supplemental carbon and at increased loading (50%−75% based on season).
3.3 Rio del Oro WWTP, NM (2-Stage Enviroquip® MBR System)
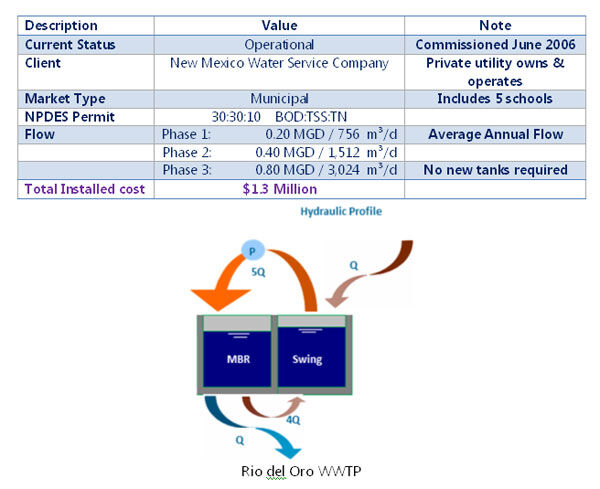
New Mexico Water Services Company owns and operates the Rio del Oro WWTP. In 2005, the company upgraded the 100,000 gpd, single train conventional activated sludge (CAS) system to a 200,000 gpd MBR system to meet Class 1A effluent for reuse. The MBR plant is operated by one full time operator with a Class 4 wastewater license. To upgrade the old CAS plant, the existing secondary clarifier was converted into two MBRs and one SND (Swing) zone. Similar to the Nassau and Islamorada plants, the process design was predicated on achieving some level of nitrification in the MBR and controlling SND in the Swing zone.
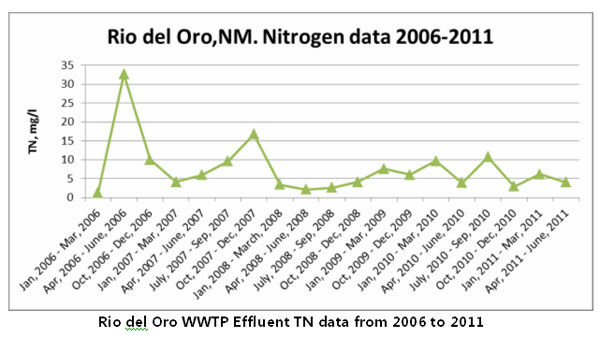
Despite the simple flowsheet, (no separate Anoxic Zone in Phase 1) the plant has consistently produced effluent total nitrogen concentrations of less than 10 mg/l, often bouncing between 2.0−4.0 mg/l. The excursions are mainly seasonal and changing the DO setpoints and cycle durations for nitrification and denitrification resolves the issue.
The benefits of integrating the MBR zone into the process flowsheet (taking advantage of the process volume and delivered oxygen) are smaller tanks, smaller supplemental aeration systems and more energy efficient operation. Moreover, incorporating SND in the PA zone and using a single recycle from the MBR to the PRAX zone, eliminates some equipment, simplifies controls and lowers overall cost of ownership. Years ago some experts were sceptical of these strategies but the long-term results of the three installations discussed herein support the design approach given proper operation. The lessons learned from the MBR and conventional plants profiled here are helping to innovate the next generation of SND technologies and applications.
4. SND innovations
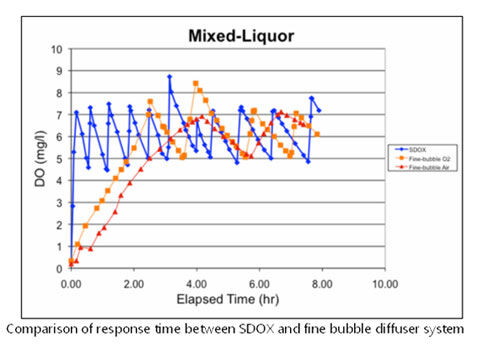
The combination of MBR and SND technologies can produce reuse quality effluent and meet the most stringent nutrient limits given the right flowsheet and appropriately sized diffused aeration systems. However, one limitation of diffused air is response time and poor control in general. Depending on site conditions and plant design, response times can be of the order of hours with measured concentrations substantially overshooting target setpoints. Poor control can limit the controllability of SND systems and commensurately limit the benefits.
One technology call SDOX® uses concentrated oxygen in lieu of diffused air and is showing promise to significantly improve process control. In simple terms, mixed liquor is pumped through a nozzle under pressure and the resulting droplets are contacted with concentrated oxygen. In the chart below, the upper and lower setpoints were set at 5 mg/l and 7 mg/l. The measured DO in the process bounced between the setpoints every 15−30 minutes whereas with diffused oxygen (and diffused air) response times were of the order of hours. For SND, setpoints are much lower but the response curves are similar.
5. Conclusion
SND remains a solid and viable option for engineers and owners for aiding in achieving tight nitrogen limits. The use of SND to improve the performance of new or greenfield plants can be a powerful tool if done properly. Here are a few of the lessons learned based on 60 installations and over a decade of application experience:
- Sludge bulking − SVI actually improved in treatment facilities if DO setpoints were changed to alternate between high DO and low DO phases compared to keeping constant low DO. For MBR systems, sludge bulking is not a concern since settling of sludge is not required.
- Process control and monitoring − the most common challenge to getting the full benefit from SND is turndown of equipment and process monitoring. Systems must be equipped with sufficient aeration turndown (usually at least 8:1) and similar process turndown (biological process coupled with permeate control for MBR systems). Automation should properly control oxygen delivery to efficiently hit operator adjustable setpoints. DO, ORP and NADH monitoring tools can be used to give reliable information on wastewater chemistry and metabolic conditions of biomass.
- Low DO impact on nitrification and denitrification rates − consistent nitrogen removal can be achieved and tight limits with ammonia-N below 1 mg/l and TN below 3 mg/l in both conventional and MBR systems. With MBR systems, due to higher solids concentrations, the aerobic and anoxic concentration gradient within in the floc is higher and better SND can be achieved as a result.
- For low nitrogen removal requirements, designing WWTPs with complicated flowsheets can yield good theoretical results but in some cases may not be practical to operate. Keeping flowsheets simple, reducing the number of recycle streams, unit operations, process zones, incorporating swing zones with SND etc. can translate into better results. During startup and for under loaded systems, following up on design models used to size systems at estimated 20-yr conditions can help operators optimize plant conditions and meet nitrogen removal requirements.


