Calculating whole life costs in MBRs

Total costs of an installation comprise the capital (of investment) expenditure (CAPEX) and the operating expenditure (OPEX).
MBR OPEX
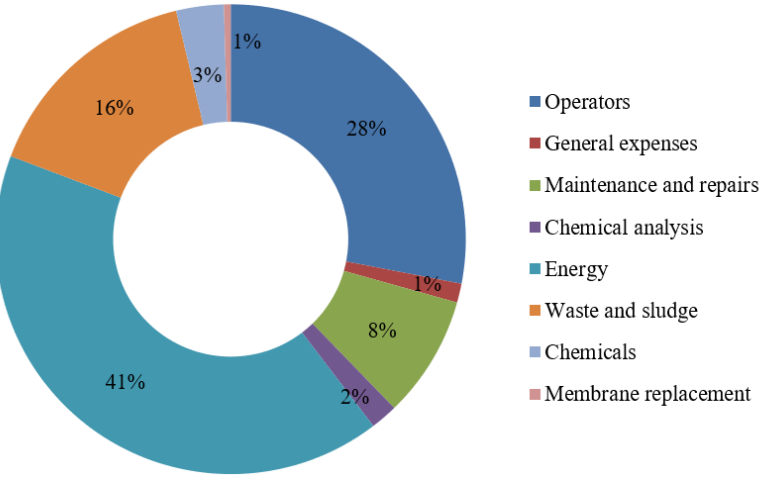
The OPEX in $ per m3 permeate is given by the combined cost of energy demand, critical component replacement, chemicals consumption, waste management/disposal and labour:
where LE is the cost of electrical energy in $/kWh, LM the membrane cost per m2 membrane area, J the flux in m/d and tmem the membrane life in years. LC, LW and LLrepresent the specific costs per m3 treated water for chemicals consumption, waste disposal and labour.
The total specific energy demand Etot in kWh/m3 is provided by the sum of the power consumption rating W in kW of the individual component, the (estimated) fractional operational period τ (hours per day of operation divided by 24) and the permeate flow Qp in m3/d:
So, for example, if a piece of equipment draws a power of 8 kW and operates on average for 8 h per day then, if the total permeate flow is 120 m3/h, the contribution to the overall specific energy demand from this component is (8/24) x 8 kW / 120 m3/h = 0.022 kWh/m3.
MBR CAPEX
Information on CAPEX is far more challenging to obtain. A review of published full-scale installations costs by Lo et al (2015) suggests CAPEX values for a plant of around 20 MLD capacity of $0.35−$0.68 m (2015 USD) per MLD for the MBR technology component. However, the CAPEX can increase considerably depending on circumstances. Young et al (2013) determined a CAPEX of up to $2.6 m/MLD when including downstream UV disinfection and primary settling.
CAPEX and OPEX can be combined to estimate the averaged net present value (NPV) according to the relationship:
where i is the annual discount rate and t the amortisation period (or plant life) in years. The discount rate allows for the change in the value of money with time. It represents the rate at which an invested sum must increase to achieve a target value after time t.
The above equation assumes that the annual OPEX doesn’t change each year. In reality, OPEX changes according to maintenance schedule, and particularly when the membranes are replaced.


