Immersed anaerobic MBRs: are they viable?

Ángel Robles1, María Victoria Ruano1, Josep Ribes1, Aurora Seco1, José Ferrer2 and Simon Judd3
1 Departament d’Enginyeria Química. Escola Tècnica Superior d’Enginyeria. Universitat de València
2 Institut Universitari d’Investigació d’Enginyeria de l’Aigua i Medi Ambient (IIAMA). Universitat Politècnica de València
3 Cranfield Water Science Institute, Cranfield University, UK
1. Introduction
There has been a recent surge of interest in anaerobic MBRs. The technology provides the potential for removing COD with a net energy benefit from the methane generated, albeit without nutrient removal. Interest within academia is evidenced by the publication of five independent reviews of the subject in various learned journals in 2012 alone (Dereli et al, 2012; Singhania et al, 2012; Skouteris et al, 2012; Smith et al, 2012; Visvanathan and Abeynayaka, 2012).
The commercial history of the anaerobic sidestream MBR (AnsMBR) process extends back to the Japanese Aqua-Rennaissance programme from the mid-late 1980s. Successive commercial technologies have been introduced based on the AnsMBR configuration: the ADUF process from Wier En Vig in South Africa, the Biorek process from Bioscan in Denmark and, most recently, the Memthane process from Veolia Water Systems. However, such systems appear to provide only fairly modest fluxes of no more than ~30 LMH for operating conditions not dissimilar to those for aerobic sMBR (aesMBR) treatment. For food wastewaters, for example, aesMBRs can generate fluxes of up to 150 LMH, such that the energy demand for the anaerobic sMBR configuration is roughly five times higher than for the aerobic one.
This energy imbalance has contributed to the development of the immersed configuration (aniMBR), which has been implemented for food wastewater treatment at full-scale in some instances (Christian et al, 2010). For the aniMBR the generated biogas can be used to scour the membrane, thus potentially eliminating the cost of operating the blowers completely provided sufficient biogas can be generated. AniMBRs thus demand that the feed is sufficiently high in BOD to generate enough biogas by methanogenesis to effectively scour the membranes.
Pilot studies of the process have been published for flat sheet (FS) membranes which suggest that fluxes of around 4−6 LMH can be sustained (Singh et al, 2010; Grant et al, 2010). However, there have been fewer pilot-scale studies of the hollow fibre (HF) configuration. One such study, conducted by the Institut Universitari d’Investigació d’Enginyeria de l’Aigua i Medi Ambient (IIAMA) at the Universitat Politècnica de València jointly with the Department of Chemical Engineering at the Universitat de València in Spain has been ongoing for 5 years. The work is based on 0.6−1.2 m3/h capacity pilot plant fed with wastewater from a nearby WWTP and fitted with full-scale membrane fibre bundles. The outcomes can therefore be considered reasonably representative of full-scale installation challenged with real municipal wastewater.
2. Experimental
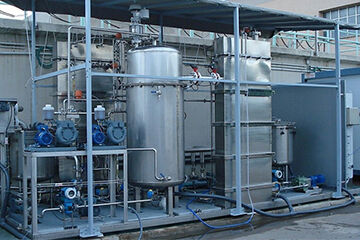
The plant is shown visually and schematically in Figures 1 and 2 respectively. It consists of a 1.3 m3 anaerobic reactor connected to two 0.8 m3 membrane tanks each containing nine 1.8 m-length commercial HF ultrafiltration fibre bundles (PURON®, Koch Membrane Systems) offering a total surface area of 30 m2/tank. Pretreatment is provided by a 0.5 mm rotofilter, followed by a 0.3 m3 equalisation tank (ET). There is also a clean-in-place (CIP) tank and pumps and blowers for sludge and gas transfer respectively. Feedwater is provided from the Carraixet WWTP in Valencia, with a mean COD of ~450 mg/L.
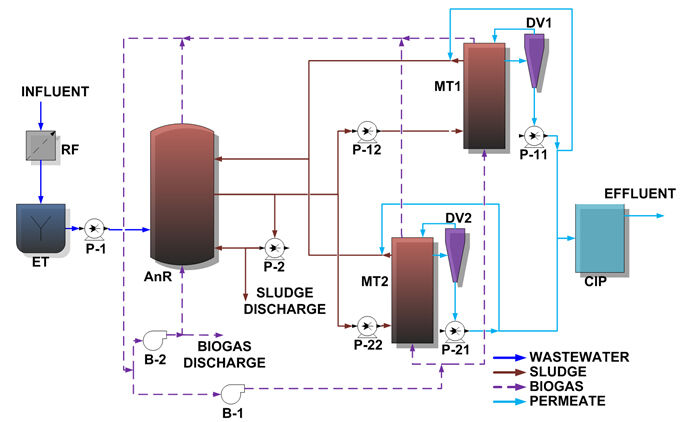
To improve agitation and gas stripping, a fraction of the produced biogas was originally recycled to the reactor; subsequently agitation was only through sludge recirculation. The sludge is continuously recirculated through the membrane tanks where permeation is achieved by vacuum filtration. Another fraction of the biogas is used for scouring the membranes. The treated permeate is stripped of dissolved biogas in a degasification vessel. An internal permeate recycle allows decoupling of the physical and biological processes: a range of fluxes can be employed without affecting the hydraulic retention time (HRT). The solids retention time (SRT) is controlled by intermittent sludge wasting.
Operation and maintenance (O&M) of the membrane is through a combination of relaxation and backflushing, with supplementary degasification and ventilation stages as required. Degasification comprises a period of high flow-rate filtration carried out to enhance the filtration process efficiency by removing the accumulated biogas from the top of the dead-end fibres. For the ventilation stage, permeate is pumped into the membrane tank through the degasification vessel instead of through the membrane, intended to recover the biogas accumulated in the degasification vessel. In terms of membrane cleaning, ventilation acts as a relaxation stage since no transmembrane flux is applied whilst maintaining a given gas sparging intensity.
The plant was operated at SRT of 70 d at a temperature of 33°C. The membranes were operated at two different normalised (to 20°C) fluxes of 13.3 and 10 LMH with O&M modes of (a) 250 s filtration (F) and 50 s relaxation (R) with 30 s of backflushing every 10 F−R cycles; (b) 30 s of ventilation every 10 F−R basic cycles; and (c) 30 s of degasification every 50 F−R basic cycles. The specific gas demand (SGDm) was set to 0.23 Nm3/h per m2 membrane area. The effect of physical cleaning stages (duration of the relaxation stage and back-flush frequency) on the temperature normalised permeability (K20) in LMH/bar was assessed by performing several short-term tests at different MLTS (mixed liquor total solids) concentrations.
3. Results and discussion
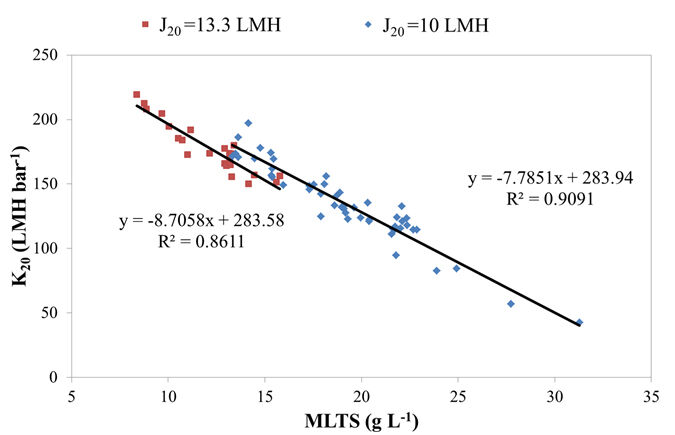
Long-term studies based on the gradual increase in solids concentration revealed the permeability to decrease linearly with increasing MLTS (Fig. 3) and permeability was also lower at the higher flux value, as expected. Further tests revealed that the permeability was recovered on decreasing the solids concentration, indicating reversibility of the fouling.
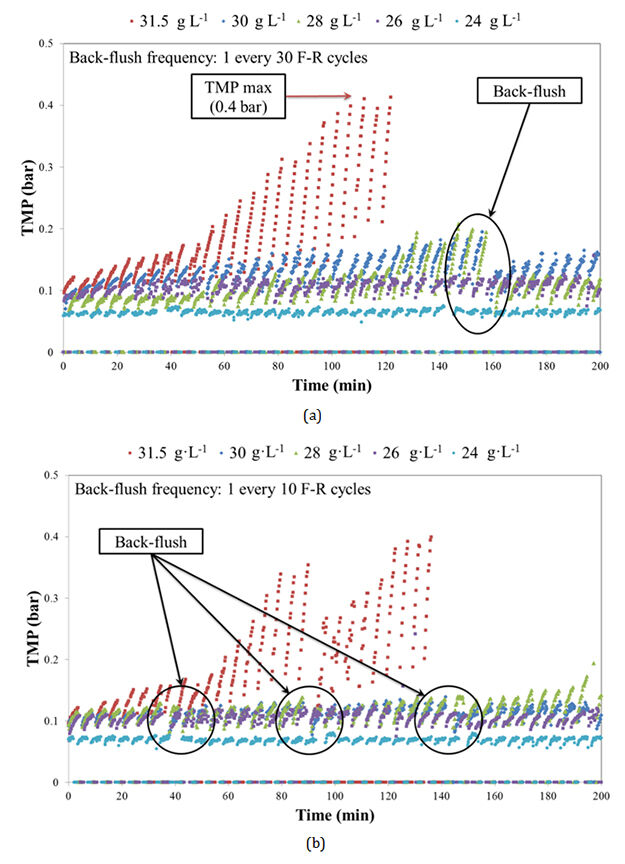
The outcomes of the long-term tests suggested a dramatic decrease in membrane permeability at MLTS concentrations above ~25 g/L. There was also an evident balance between MLTS and SGDm, since above this threshold MLTS value the gas scour rate was insufficient to sustain the permeability even at the lower applied flux of 10 LMH. On the other hand, at a slightly lower MLTS value of 23 g/L the applied flux of 13 LMH could apparently be sustained. Having thus established this critical threshold MLTS value, further work was conducted to identify appropriate membrane physical cleaning O&M protocols for maintaining permeability at high MLTS levels (Figure 4).
According to these figures, at MLTS concentrations below 28 g/L and fluxes of 10 LMH with a backflush frequency of 1 backflush every 10 F−R cycles, total permeability recovery was achieved from relaxation alone. Moreover, the membrane performance was not critically affected by relaxation duration over a period of 30−60 s. For the most benign conditions studied, comprising a flux of 10 LMH and an MLTS below 26 g/L, the TMP recovery did not depend on backflush frequency (Figure 4a). Above this MLTS value TMP increased significantly, necessitating an increased backflush frequency to maintain the TMP below a threshold of 0.4 bar. This threshold value was exceeded at MLTS concentrations above 30 g/L, but relaxation alone largely recovered the permeability without recourse to backflushing.
Membrane performance improved considerably on increasing the backflush frequency from every 30 F−R cycles to every 10 F−R cycles, although the TMP threshold of 0.4 bar was still exceeded for MLTS concentrations above 30 g/L. The membrane tank MLTS concentration increased according to the recirculation ratio, and would have been expected to have reached a value of 35 g/L for a reactor tank MLTS concentration of 31 g/L at the recirculation ratio employed. The high fouling rate observed at 31.5 g/L, increasing from 7 to 65 mbar/min, is consistent with this solids concentration polarisation effect. This trend corroborates the observed trend of decreasing permeability with increasing MLTS shown in Figure 3 for the long-term studies.
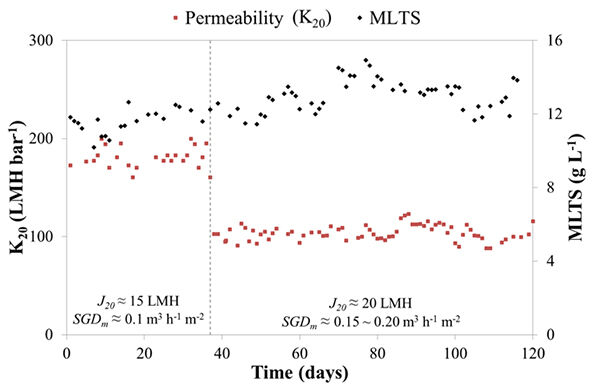
It stands to reason that decreasing the MLTS would be expected to increase the permeability and thus flux in the same way that increasing MLTS evidently suppresses the permeability. Further studies conducted at lower solids concentrations (Fig. 5) have shown this to be the case, with fluxes of around 20 LMH at an MLTS concentration of 14 g/L.
With regards to biological treatment performance, the COD was removed down to 77 mg/L on average (and thus 83% removal). As expected the impact on nutrient levels (ammonia and phosphorus) was negative, both increasing by 15−20% to 33 mg/L and 3.1 mg/L respectively. Nutrient removal would thus demand further treatment.
4. Conclusions
Pilot-scale testing has demonstrated that an anaerobic immersed hollow fibre MBR (aniHFMBR) challenged with municipal wastewater can be sustainably operated at a flux of around 15 LMH for an MLTS of 20 g/L when backflushed every 10 filtration−relaxation cycles at a specific gas scour demand (SGDm) of 0.2 Nm3/(m2.h). Most recent research has indicated that it is possible to achieve even higher fluxes (~20 LMH) at lower SGDm values (0.1−0.15 Nm3/(m2.h)) at an MLTS concentration of 14 g/L under the same physical cleaning regime, emphasising the significant impact solids concentration has on flux for an aniMBR challenged with municipal wastewater. The net fluxes attained are also significantly affected by relaxation and backflushing, with fouling apparently being reversible.
The results suggest that the treatment of wastewaters with a sufficiently high COD to generate 5−10 Nm3 biogas per m3 permeate would be self-sustaining with respect to membrane scour, through still demanding supplementary energy for backflushing.


